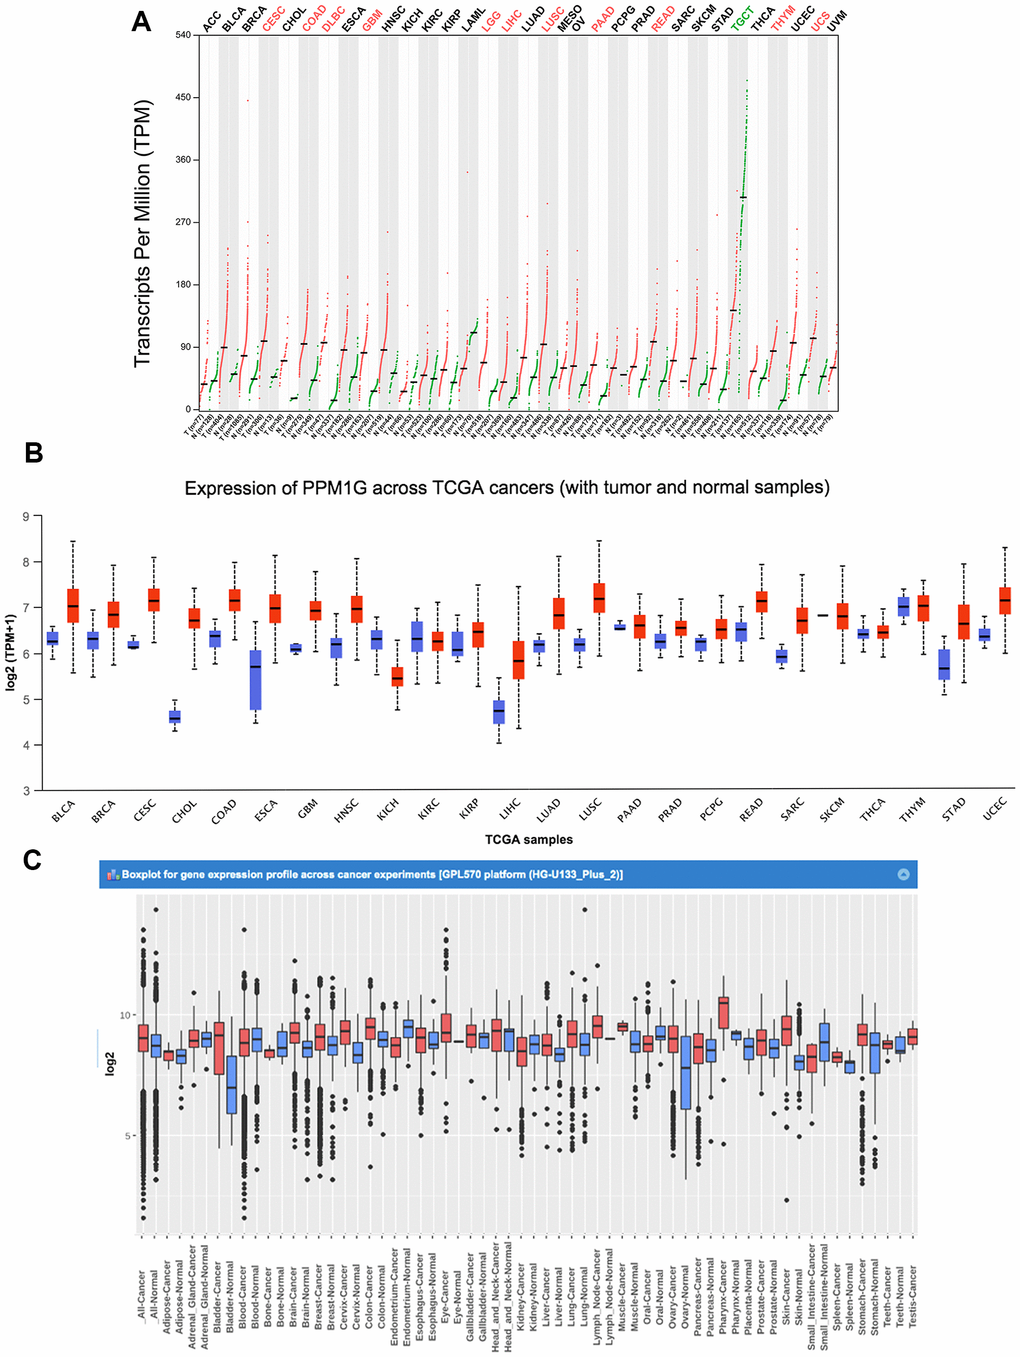
Figure 1.PPM1G mRNA expression in various types of cancer. (A) The expression of PPM1G in 33 types of human cancer (GEPIA). The gene expression profiles across all tumor samples and paired normal tissues are shown in a dot plot, and each dot represents the expression profile in one sample. (B) PPM1G expression in 24 types of cancers (UALCAN). The box plot shows the gene expression levels in different cancers and normal tissues as the interquartile range (IQR), including the minimum, 25th percentile, median, 75th percentile and maximum values. Red boxes represent tumor tissues, and green boxes represent normal tissues. (C) Data concerning PPM1G mRNA expression in various types of cancer (GENT). The boxes represent the median and the 25th and 75th percentiles. The dots represent outliers. The red boxes represent tumor tissues, and the green boxes represent normal tissues.