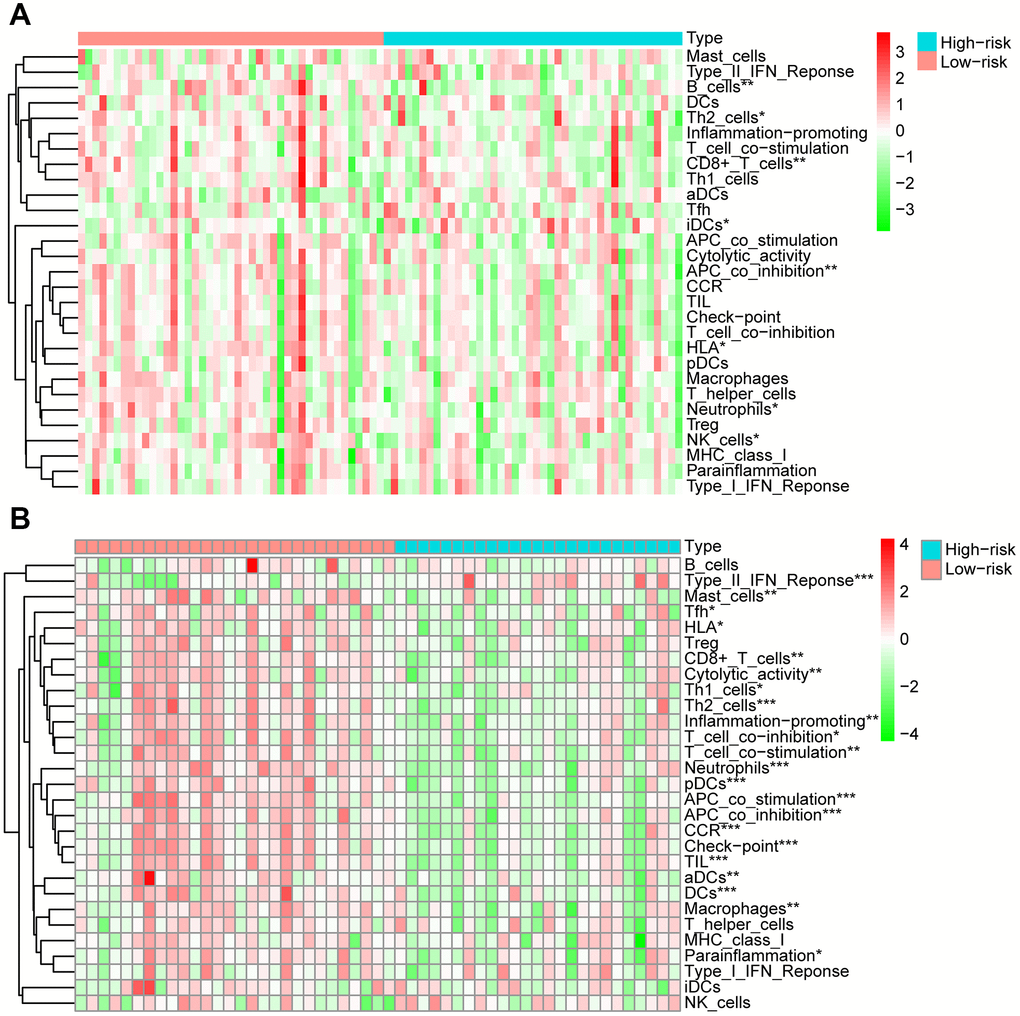
Figure 7.Analysis of 29 immune gene sets between high- and low-risk groups of OS. The heatmap was used to visualize the proportions of these gene sets between high- and low-risk groups of OS in training cohort (A) and validation cohort (B).
Figure 7 — Identification of a novel glycolysis-related gene signature for predicting the prognosis of osteosarcoma patients | Aging