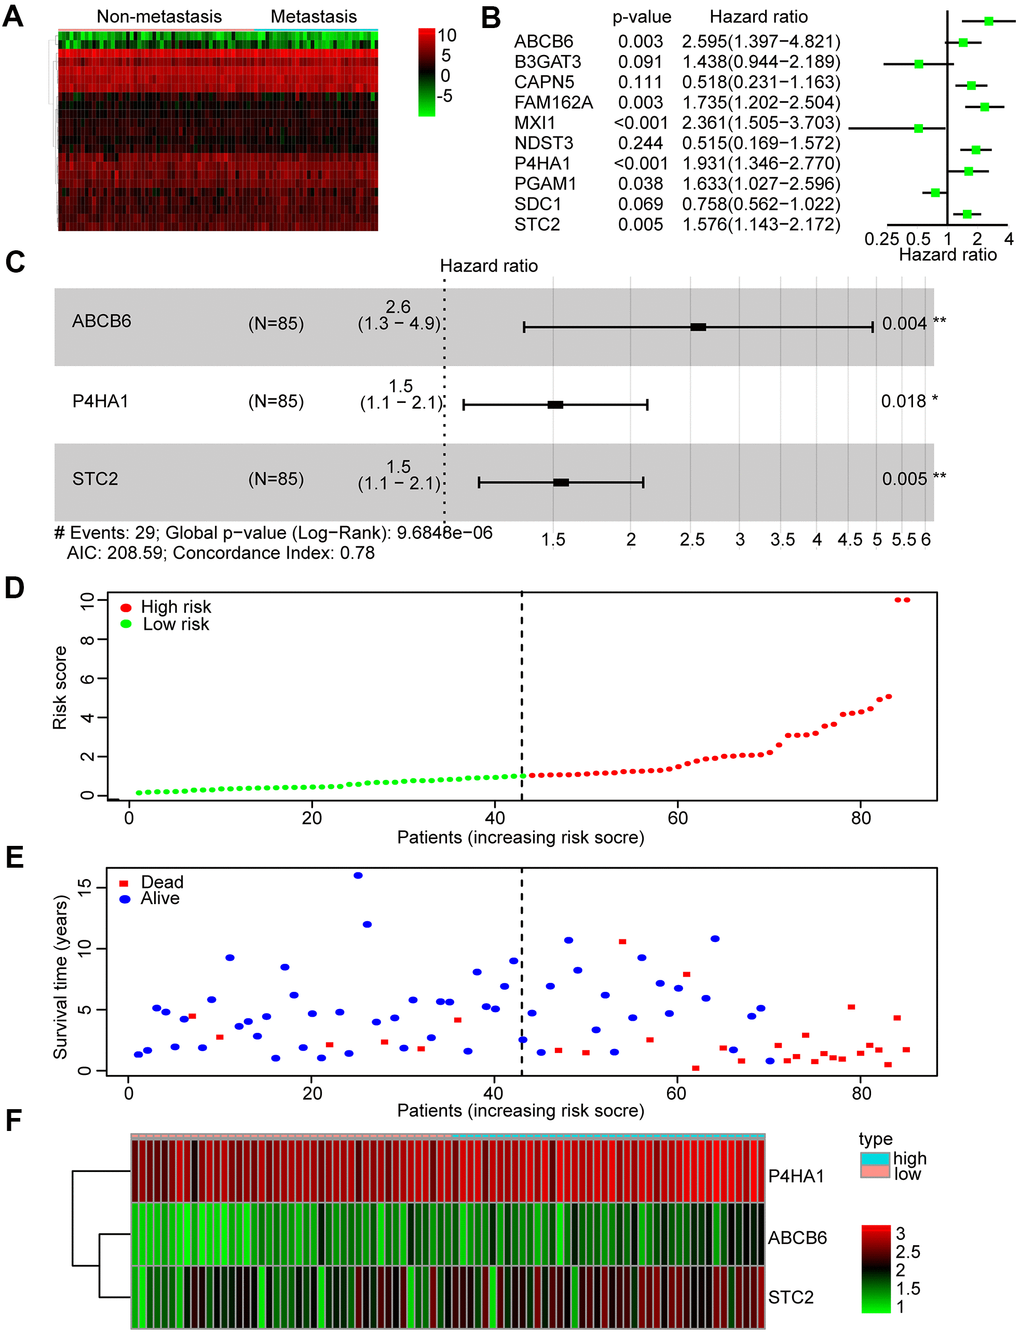
Figure 2.Identification and construction of a three-mRNA signature to predict the prognosis of patients with OS. (A) Heatmap was constructed showing 23 differentially expressed glycolysis-related genes in metastasis OS tissues compared with non-metastasis tissues. (B) Forest plot of univariate Cox regression analysis of the survival-related 10 differentially expressed genes in OS. (C) Multivariate cox regression analysis identified a risk signature include 3 glycolysis-related genes among the 10 differentially expressed genes. (D) Distribution of risk score in the high-risk group and the low-risk group. (E) Survival status between the high-risk group and the low-risk group. (F) Heatmap of the expression profile of the included glycolysis-related genes.