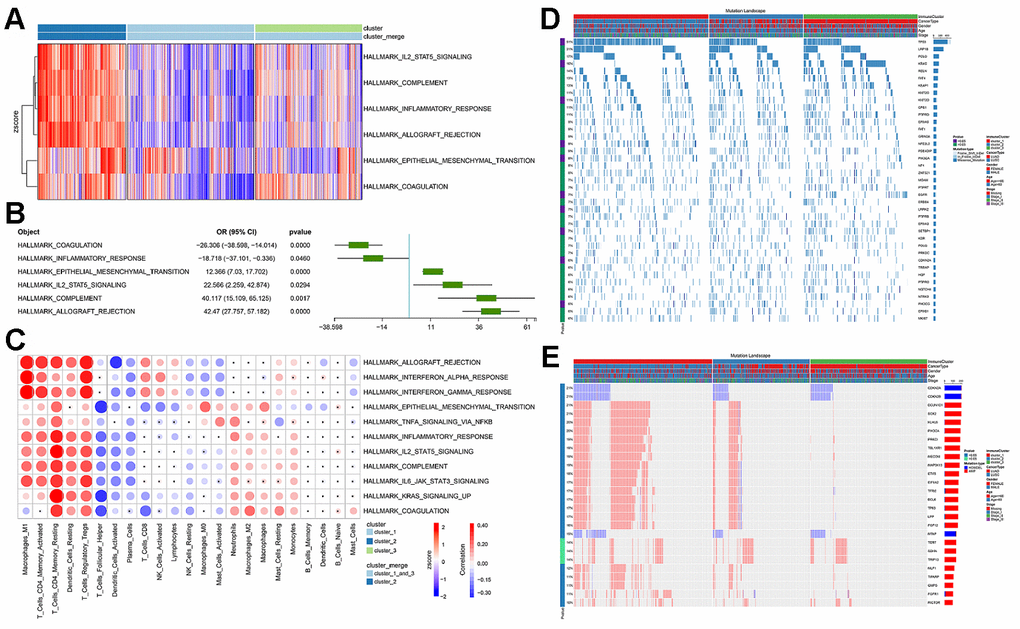
Figure 5.The functional differences involved in cluster 2 and the correlation between immune infiltration and cluster 2. (A) GSVA score spectrum of functional gene set in cluster 2. (B) Application of logistic regression to identify pathways that were significantly related to cluster 2. (C) Correlation between cluster function and immune infiltration. (D) Gene mutation characteristic blueprint of TCGA-NSCLC immune subgroup. 39 oncogenes mutated in >6% samples in the three immune subgroups of TCGA-NSCLC (missense mutation, dark blue; insert deletion, light blue). The bar graph on the right represents the mutation frequency of each gene in the sample population, and the colored bar graph on the left represents whether the occurrence of the gene mutation was related to the immune subgroup (chi-square test). Each column represents a patient, and the colored bar chart at the top indicates the immune subgroup to which the patient belonged: the subtype of NSCLC, the patient's gender, age group, and tumor grade. (E) Copy number variation blueprint of TCGA-NSCLC immune subgroups; the status of 26 oncogenes with copy number changes in >10% samples in the three immune subgroups of TCGA-NSCLC (copy number amplification, red; copy number deletion, blue). The bar graph on the right represents the copy number variation frequency of each gene in the sample population. The colored bar chart on the left represents whether the occurrence of copy number variation of the gene was related to the immune subgroup (chi-square test). Each column represents a patient, and the colored bar chart at the top indicates the immune subgroup to which the patient belonged: the subtype of NSCLC, the patient's gender, age group, and tumor grade.