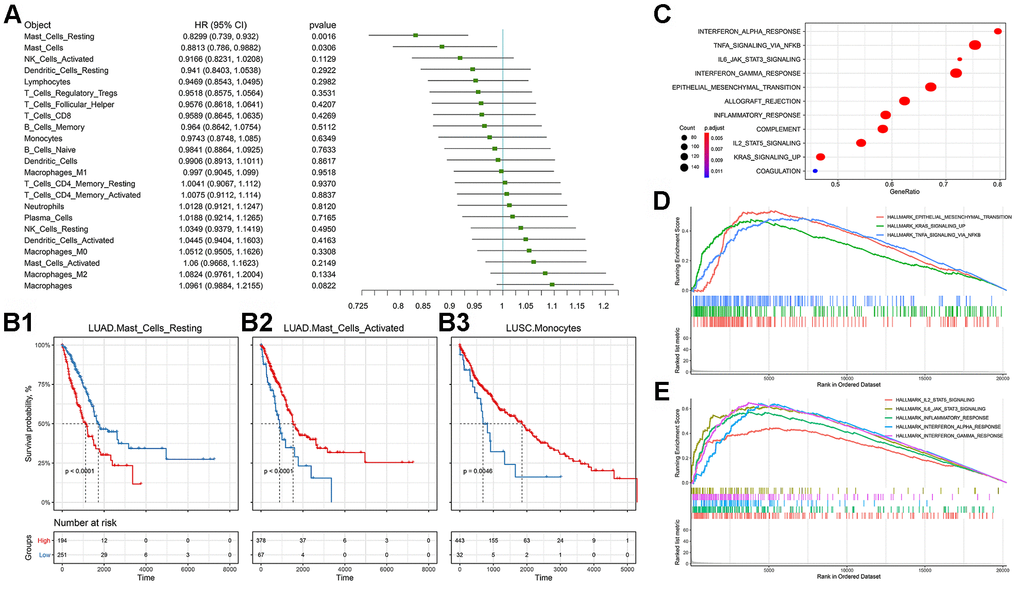
Figure 4.Prognostic efficacy of immune cell infiltration in TCGA-NSCLC and the functional differences involved in cluster 2. (A) Prognostic efficacy of immune cell infiltration in TCGA-NSCLC: Forest plot of the prognostic efficacy of immune cells. Single factor cox regression was used to evaluate the significance of the correlation between cell infiltration ratio and Overall Survival (OS). (B) Prognostic efficacy of immune cell infiltration in TCGA-NSCLC: In the corresponding metabolic subtypes, the Kaplan-Meier curve of the two groups of patients with high and low cell infiltration (Low). The log-rank test was used for calculating the difference in OS between the high and low groups. The division threshold was based on the maximum selection method. (C) Functional differences involved in cluster 2: Identifying the functional differences based on the GSEA method. The MSigDB cancer hallmark gene set was used. (D) Functional differences involved in cluster 2: Visualization of important cancer-related pathways. (E) Functional differences involved in cluster 2: Visualization of important immune-related pathways.