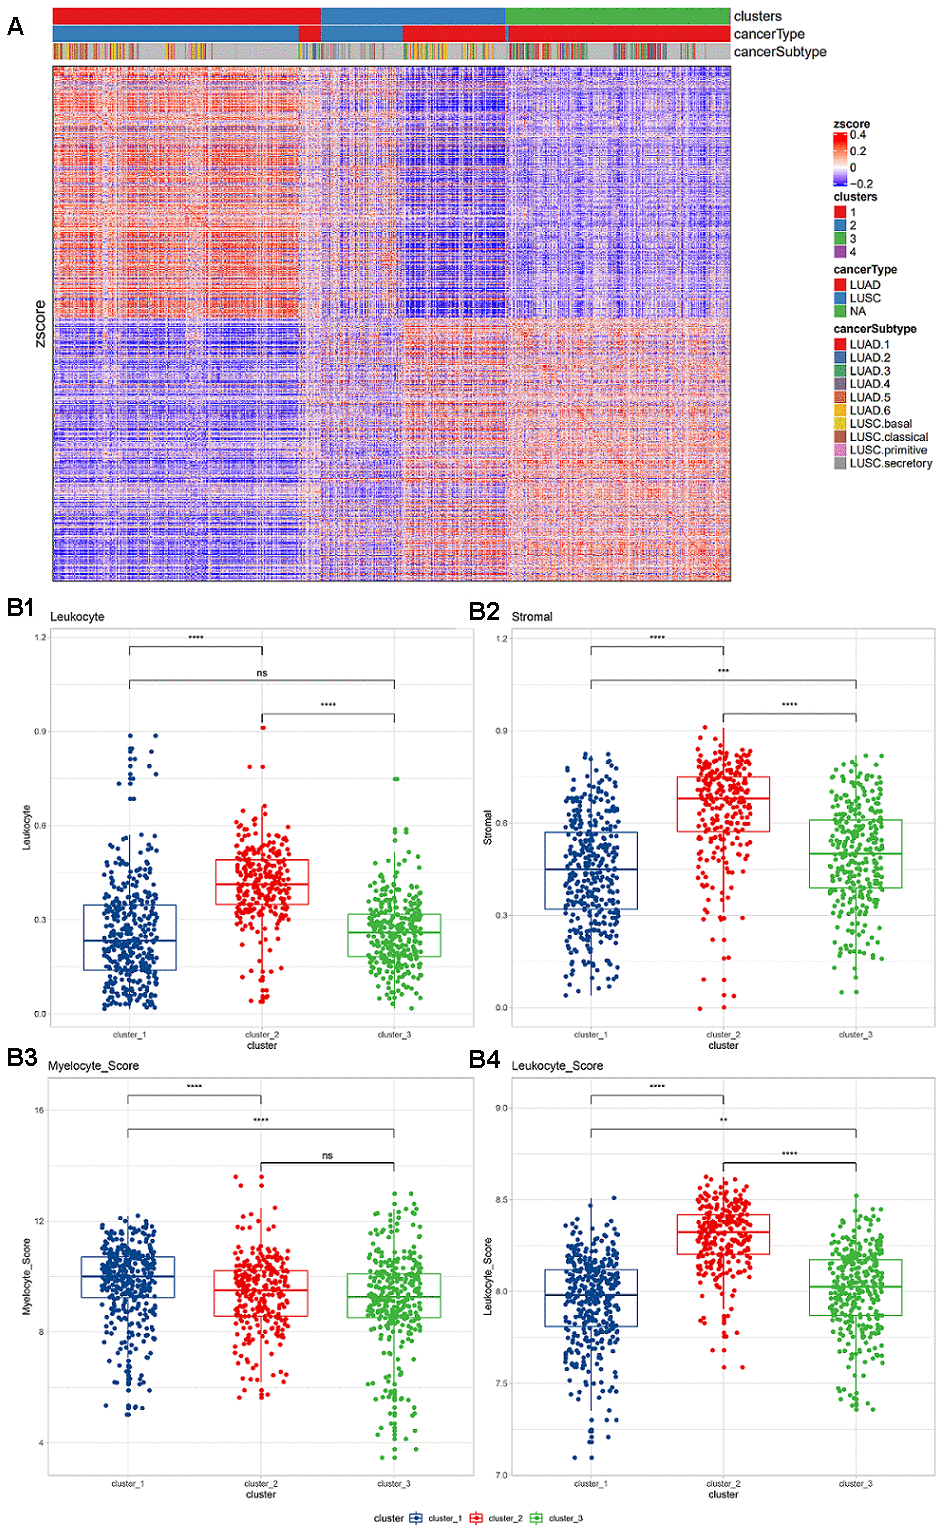
Figure 1.(A) Expression of immune-related genes in TCGA non-small cell lung cancer data. Pearson correlation distance and ward.D2 were used for unsupervised clustering. The top annotations represent the subgroups, cancer types, and TCGA cancer subtypes identified based on consistent clustering. (B) Lymphocyte and myeloid cell infiltration and stromal cell distribution among subgroups. (B1) Lymphocyte infiltration in different clusters; (B2) stromal cell distribution in different clusters; (B3) myelocyte infiltration score in different clusters; (B4) lymphocyte infiltration score in different clusters. The Wilcoxon rank-sum test (*, P<0.05; **, P<0.01; ***, P<0.001; ****, P<0.0001) was used for statistical difference testing among different groups.