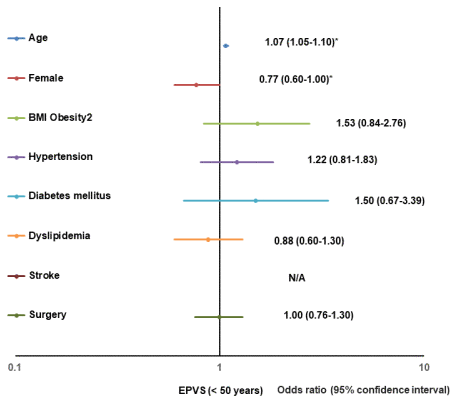
Figure 3.Forest plot of multivariate logistic regression analysis for a positive change of EPVS (< 50). BMI, body mass index; EPVS, enlargement of perivascular space; N/A, not applicable.
Figure 3 — Prevalence and risk factors for brain white matter changes in young and middle-aged participants with Brain Dock (brain screening): a registry database study and literature review | Aging