Submit an Article
Navigate
Home
Editorial Board
Editorial Policies
Current Volume
Archive
Scientific Integrity
Publication Ethics Statements
Interviews with Outstanding Authors
Newsroom
Sponsored Conferences
Podcast
Contact
Special Collections
Submit an Article
Online ISSN: 1945-4589
Research Paper
|
Volume 13, Issue 7
|
pp. 9496–9509
Prevalence and risk factors for brain white matter changes in young and middle-aged participants with Brain Dock (brain screening): a registry database study and literature review
Back to article
Figure 1
(1 of 4)
−
100%
+
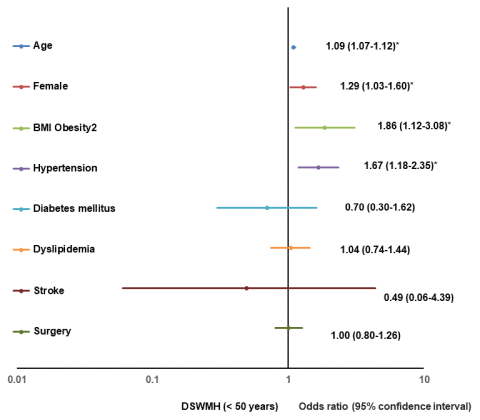
Figure 1.
Forest plot of multivariate logistic regression analysis for a positive change of DSWMH (< 50).
BMI, body mass index; DSWMH, deep subcortical white matter high intensity.