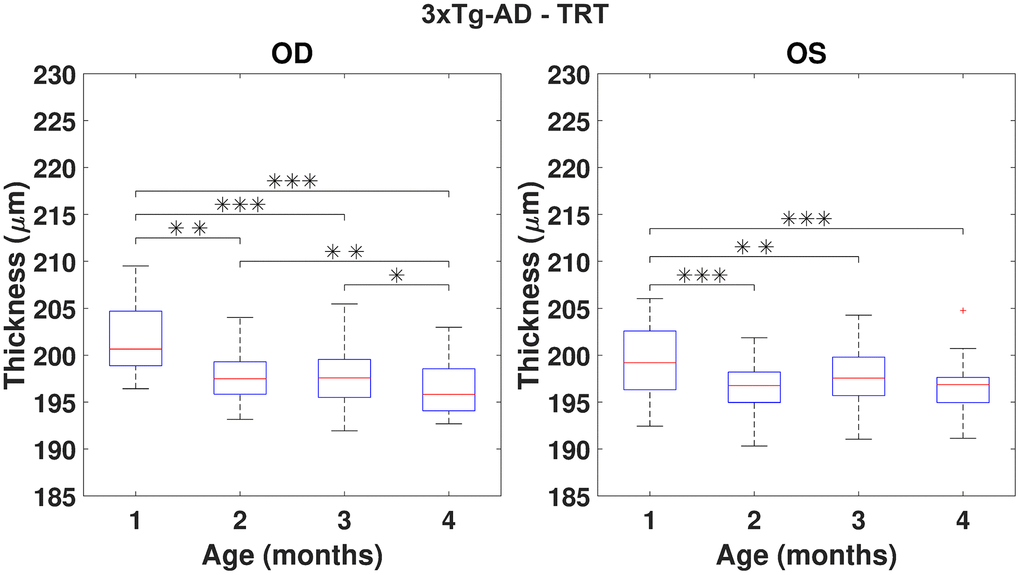
Figure 4.Boxplot of the total retinal thickness (TRT) (in μm) for each time point, for right (OD) and left (OS) eyes of 3×Tg-AD mice (respectively, left and right graphs). One, two and three asterisks represent, respectively, statistically significant differences at the level of 5%, 1% and 0.1%, based on pairwise comparisons. No statistically significant differences were found when comparing right to left eyes at any time point.