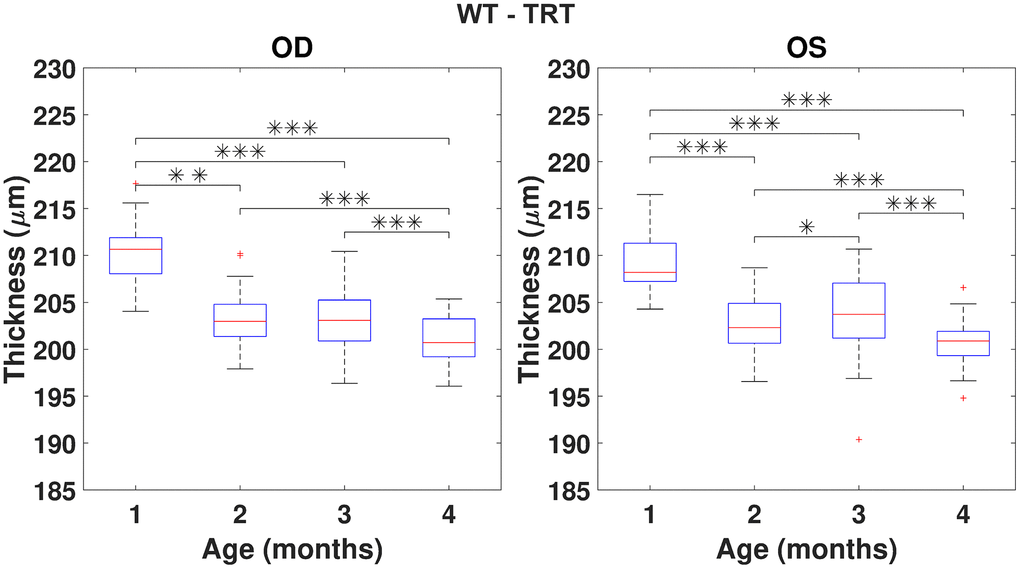
Figure 3.Boxplot of the total retinal thickness (TRT) (in μm) for each time point, for right (OD) and left (OS) eyes of WT mice (respectively, left and right graphs). One, two and three asterisks represent, respectively, statistically significant differences at the level of 5%, 1% and 0.1%, based on pairwise comparisons. No statistically significant differences were found when comparing right to left eyes at any time point.