Submit an Article
Navigate
Home
Editorial Board
Editorial Policies
Current Volume
Archive
Scientific Integrity
Publication Ethics Statements
Interviews with Outstanding Authors
Newsroom
Sponsored Conferences
Podcast
Contact
Special Collections
Submit an Article
Online ISSN: 1945-4589
Research Paper
|
Volume 13, Issue 7
|
pp. 9433–9454
Longitudinal normative OCT retinal thickness data for wild-type mice, and characterization of changes in the 3×Tg-AD mice model of Alzheimer's disease
Back to article
Figure 2
(2 of 5)
−
100%
+
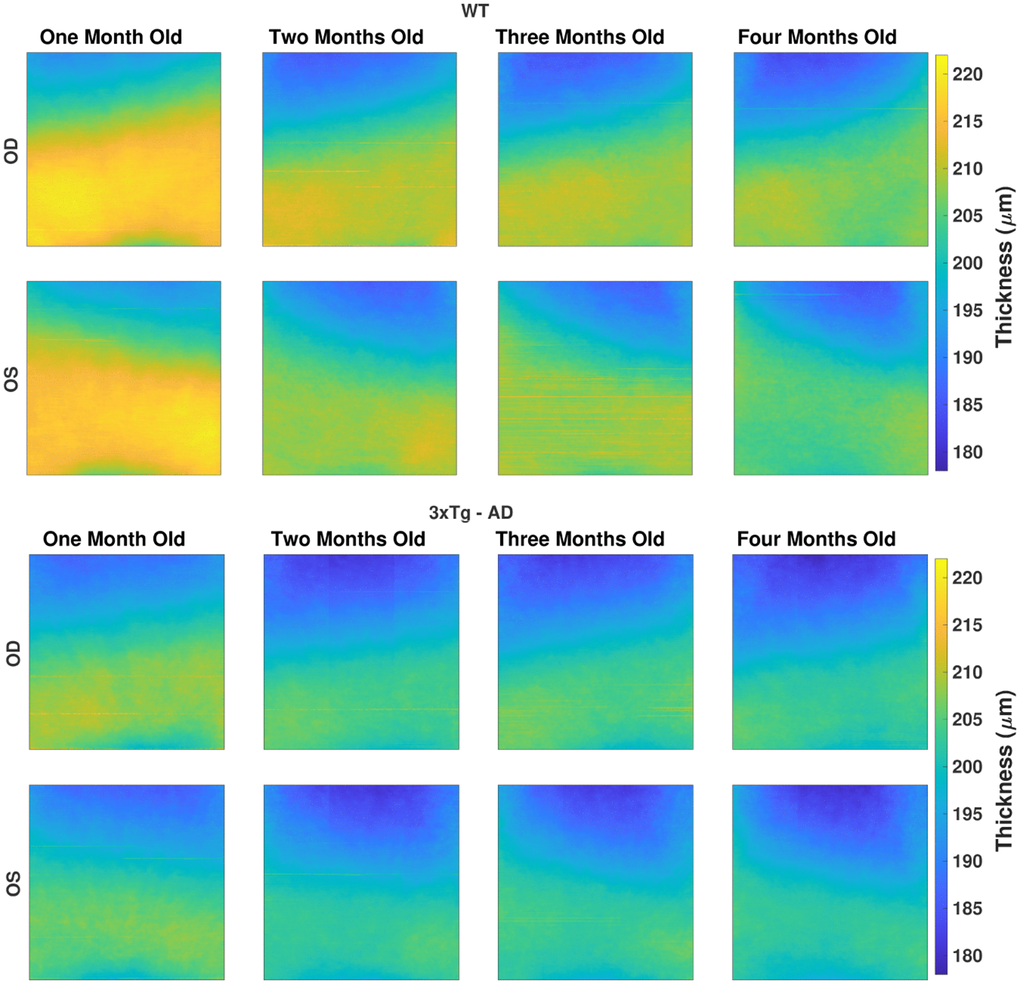
Figure 2.
The average total retina thickness map (in μm) for both WT (top) and 3×Tg-AD group (bottom), separated by eye (rows), right (OD) and left eyes (OS), and by age (columns).
The color range is consistent for all maps.