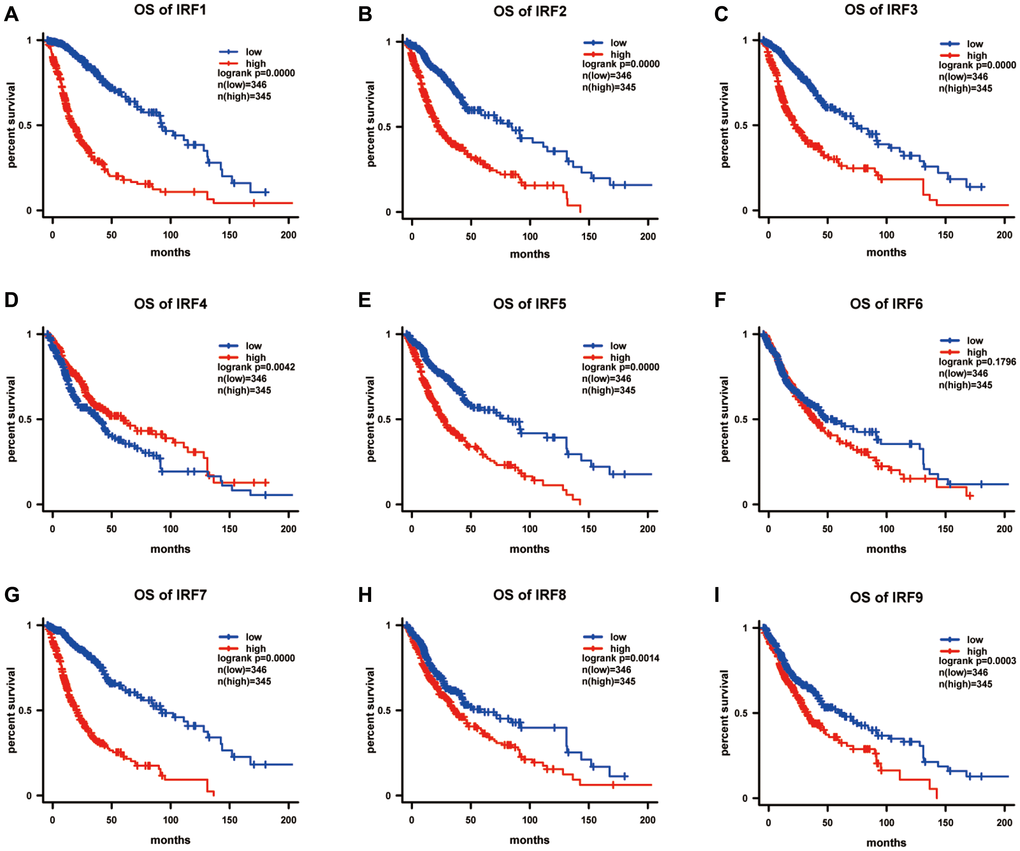
Figure 4.The prognostic value of IRF family members in predicting overall survival of glioma patients (OS). The survival curves for (A) IRF1, (B) IRF2, (C) IRF3, (D) IRF4, (E) IRF5, (F) IRF6, (G) IRF7, (H) IRF8, and (I) IRF9 in glioma using the Kaplan-Meier method. *P <0.05.