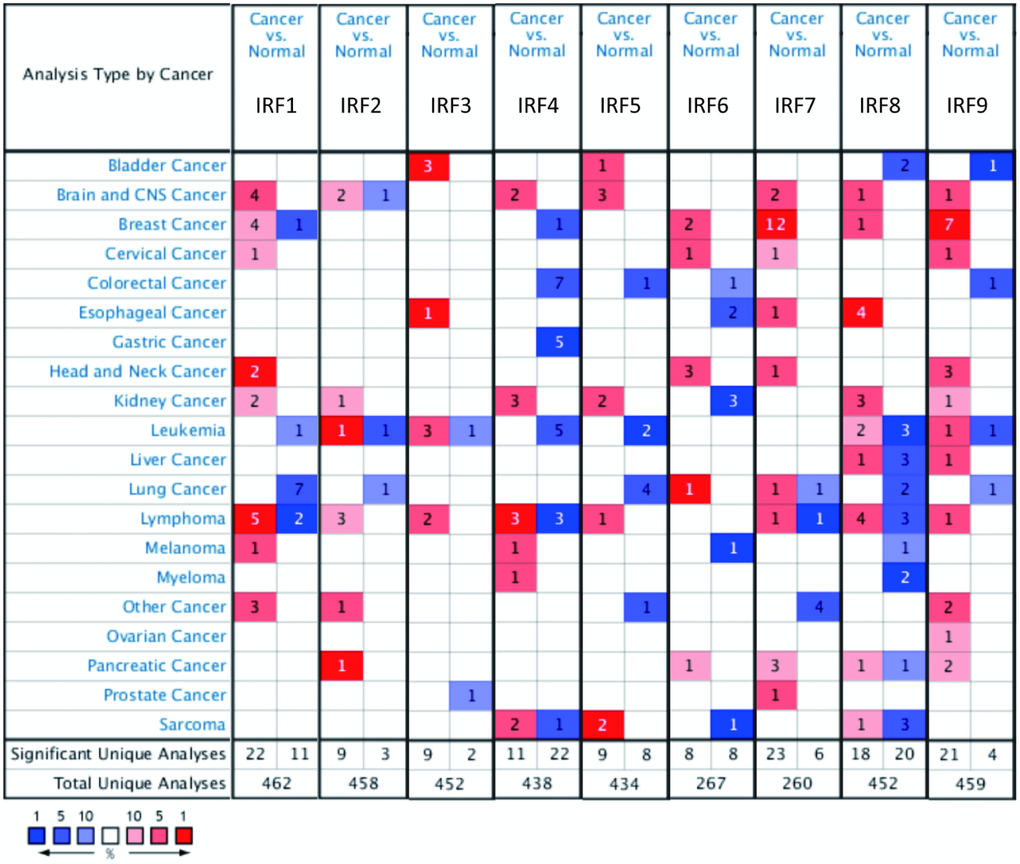
Figure 1.Transcript levels of the nine IRF family members in different types of cancer (ONCOMINE). The value inside each box indicates the number of datasets with statistically significant IRF hyper- (red) or hypo-expression (blue). Differences were compared using STUDENT’S t-test. p-value: 0.05, fold change: 2, gene rank: 10%, data type: mRNA.