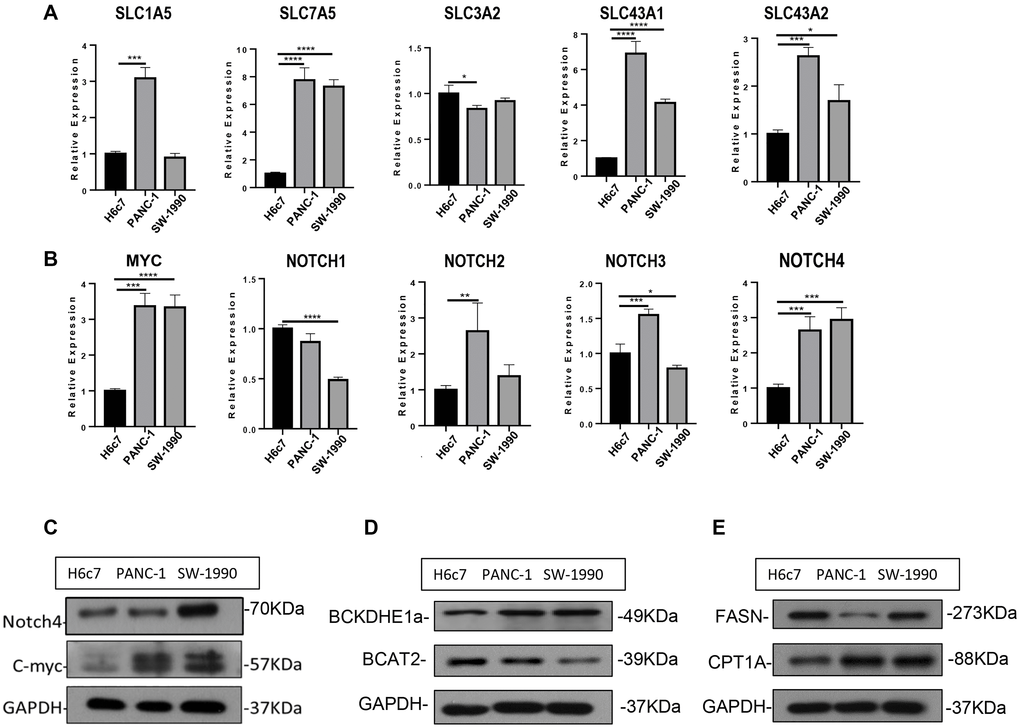
Figure 4.Experimental verification of the bioinformatic results. (A) mRNA expression of SLC carriers in H6c7, PANC-1 and SW-1990 cell line. (B) mRNA expression of MYC and NOTCH in H6c7, PANC-1 and SW-1990 cell line. (C–E) Protein expression of MYC, NOTCH4, BCAT2, CPT1A and FASN in H6c7, PANC-1 and SW-1990 cell line.