Submit an Article
Navigate
Home
Editorial Board
Editorial Policies
Current Volume
Archive
Scientific Integrity
Publication Ethics Statements
Interviews with Outstanding Authors
Newsroom
Sponsored Conferences
Podcast
Contact
Special Collections
Submit an Article
Online ISSN: 1945-4589
Research Paper
|
Volume 13, Issue 8
|
pp. 11907–11918
GEO data mining and TCGA analysis reveal altered branched chain amino acid metabolism in pancreatic cancer patients
Back to article
Figure 3
(3 of 5)
−
100%
+
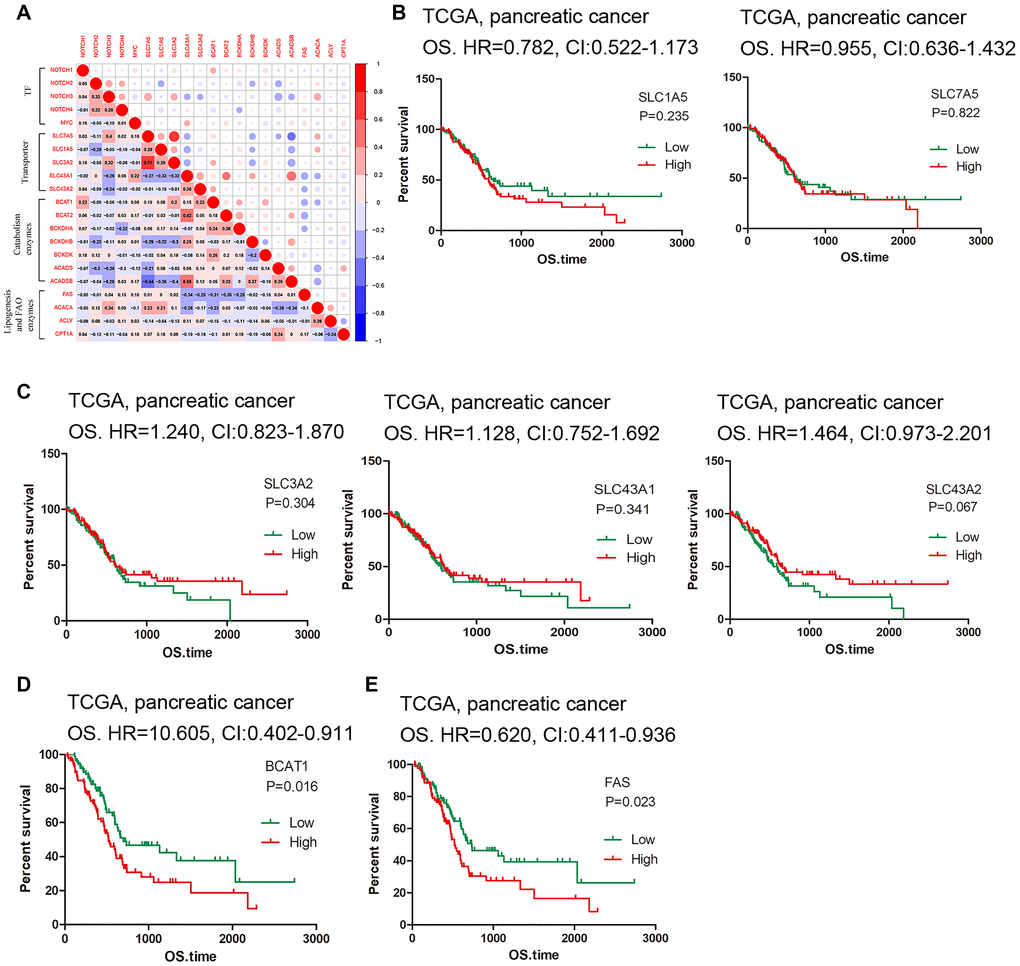
Figure 3.
Correlation and survival analysis of the hub genes.
(
A
) Matrix showing degree of correlation among the selected genes. (
B
–
C
) Survival curves of SLC carriers. (
D
–
E
) High expression of BCAT1 and FAS indicated low survival rate.