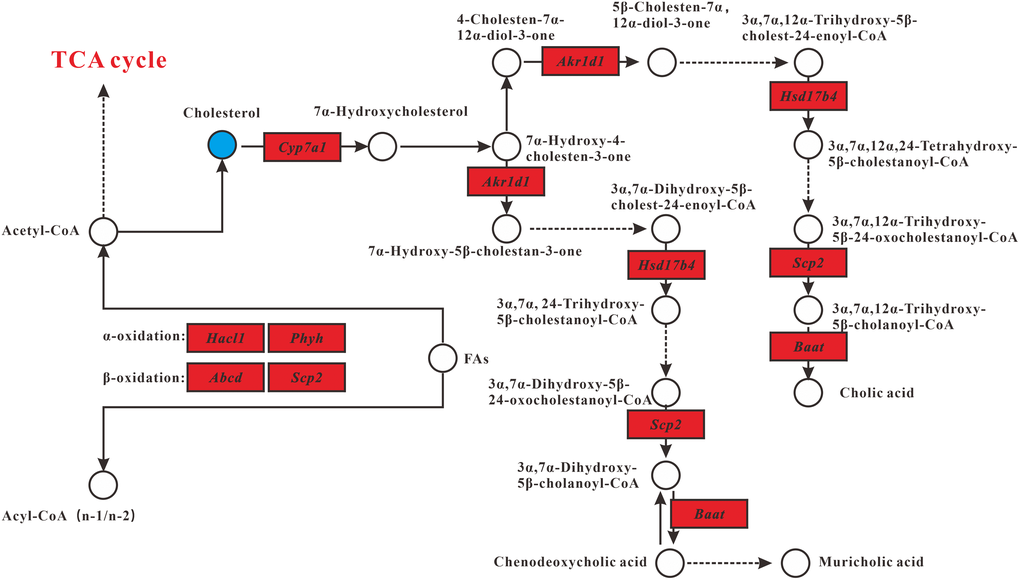
Figure 4.Lipid metabolism alterations. Upregulated and downregulated genes in MT group compared with DM group are depicted as red box and green box respectively. Metabolites up- and downregulated are shown by yellow and blue circles, respectively.
Figure 4 — Integrated metabolomics and transcriptomics reveal the anti-aging effect of melanin from Sepiella maindroni ink (MSMI) on D-galactose-induced aging mice | Aging