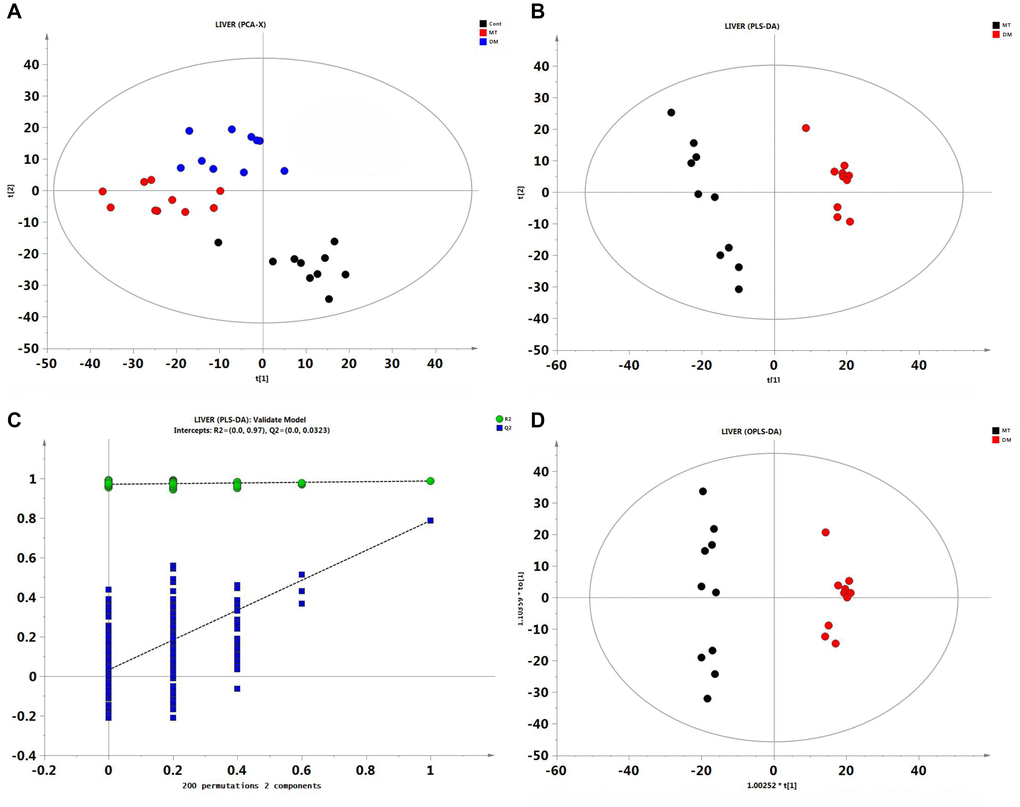
Figure 2.Multivariate statistical analysis of liver GC/MS data. (A) PCA score plot among control, DM and MT groups. (B) PLS-DA score plot comparing DM and MT groups. (C) The result of permutation test, R2 (green circle), Q2 (blue square). (D) PLS-DA score plot comparing DM and MT groups.