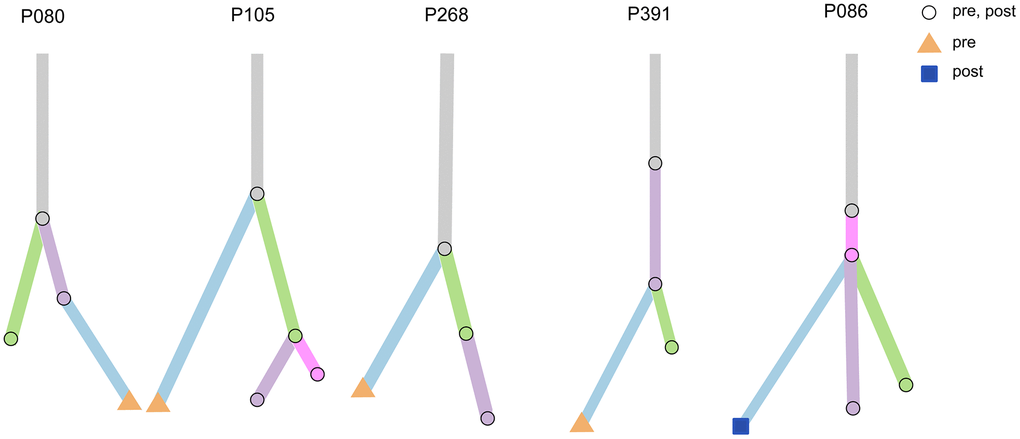
Figure 8.Clonal analysis of multiple testing in five patients. Five examples of evolutionary trees. The circles represent mutations present in both pre-treatment and post-treatment; the triangles represent mutations present only in pre-treatment, and squares represent mutations present only in post-treatment.