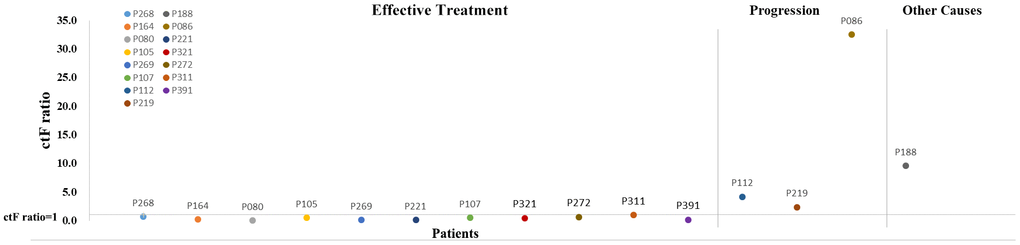
Figure 6.Scatter diagram for ctF ratio of 15 patients with two or more cfDNA tests. The horizontal line on the abscissa indicates that the ctF ratio is 1. Each dot represents one patient. cfDNA, cell-free DNA; ctF, cfDNA allele frequency.
Figure 6 — Genetic landscape of breast cancer and mutation tracking with circulating tumor DNA in Chinese women | Aging