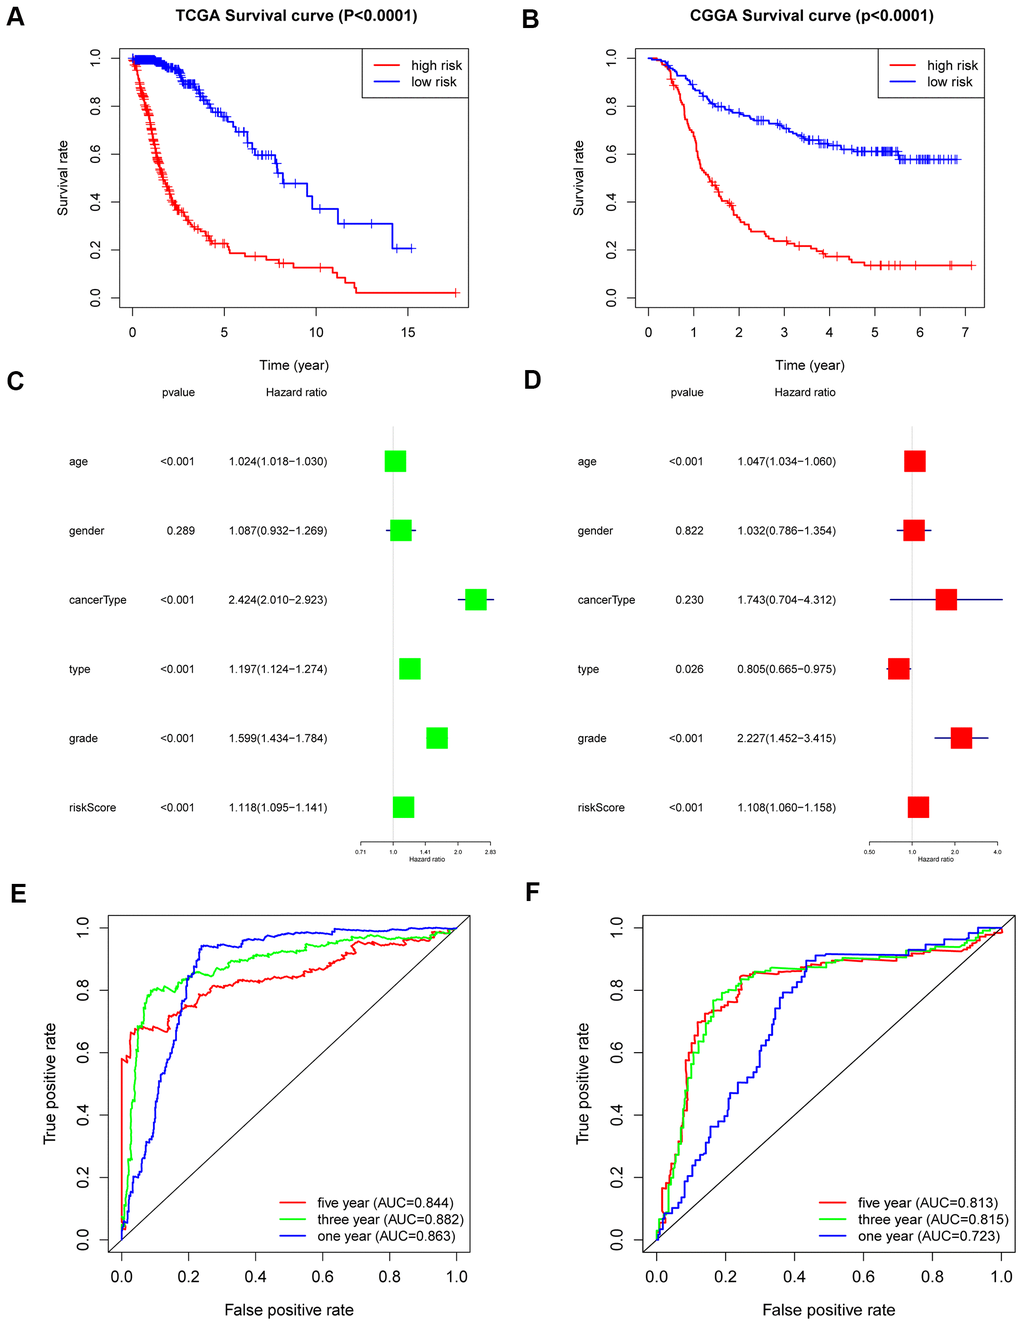
Figure 4.Outcome prediction of the 6-gene signature in stratified patients of the TCGA cohort and CGGA cohort. (A) Kaplan-Meier overall survival analysis between the high- and low-risk groups in the TCGA cohort. (B) Kaplan-Meier overall survival analysis between the high- and low-risk groups in the CGGA cohort. (C, D) Univariate (C) and multivariate Cox regression (D) analyses of clinical features and the 6-gene-based risk score for OS in the TCGA dataset. (E) ROC curves indicating the sensitivity and specificity of predicting 1-, 3- and 5-y survival with the MES-related signature in the TCGA dataset. (F) ROC curves indicating the sensitivity and specificity of predicting 1-, 3- and 5-y survival with the MES-related signature in the CGGA dataset.