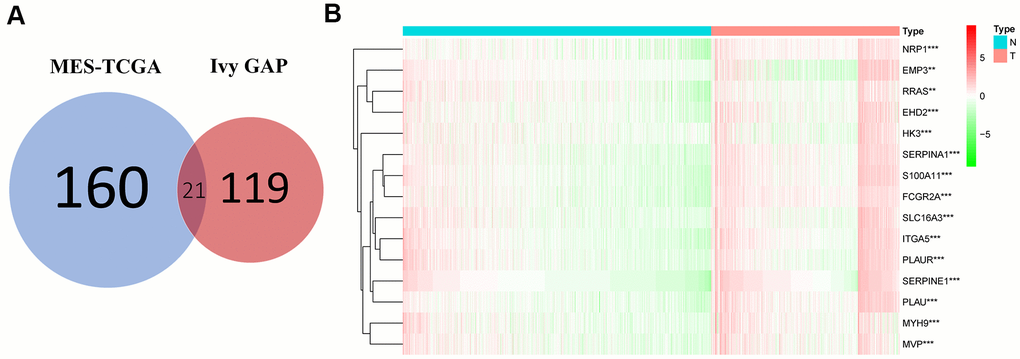
Figure 1.Acquisition and verification of MES-related genes. (A) Venn diagram indicating that 21 MES-related genes were selected from the Ivy GAP and TCGA databases. (B) The heat map shows that 15 of the MES-related genes were significantly different between the normal and tumor groups. **P <. 01; ***P < 0.001.