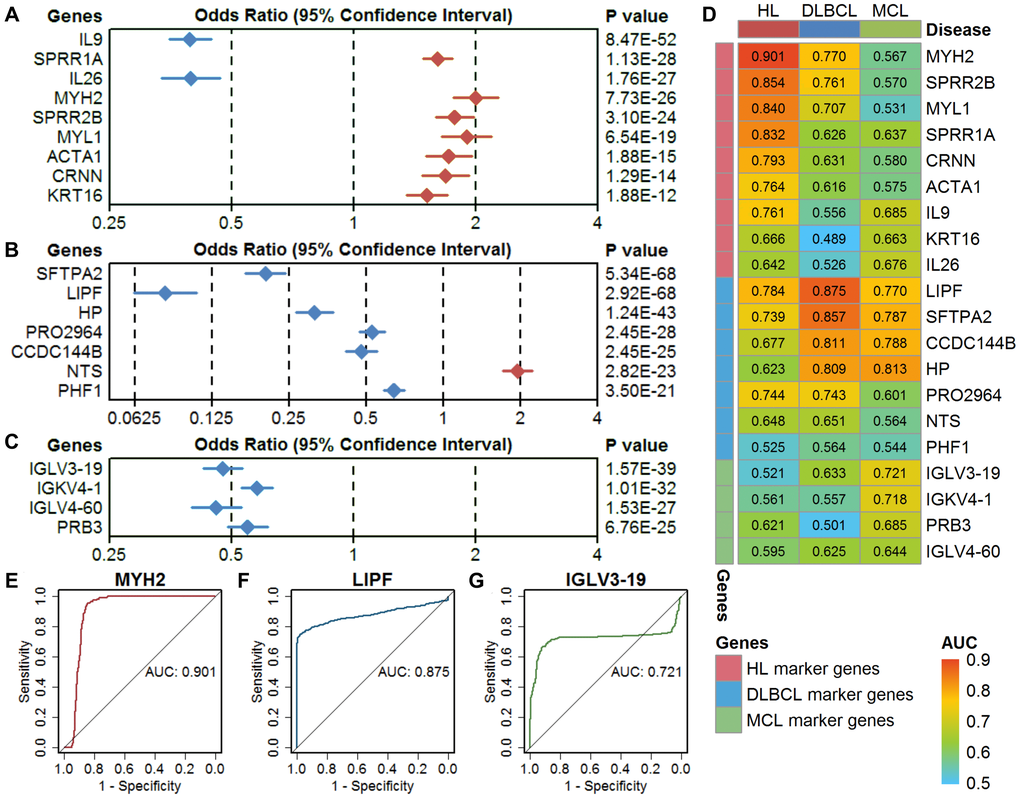
Figure 3.Evaluation of single-gene models in three types of lymphoma. (A–C) The classification performance of HL marker genes, DLBCL marker genes, and MCL marker genes using a univariate logistic regression model. The diamond shape indicates the odds ratio (OR), and the line indicates the 95% confidence interval (CI). The red color indicates OR > 1, and the blue color indicates OR < 1. (D) The area under the curve (AUC) of the marker genes in three types of lymphoma. (E–G) Receiver operating characteristic (ROC) curves of the optimal single-gene model in HL (MYH2), DLBCL (LIPF), and MCL (IGLV3-19). HL, Hodgkin's lymphoma; DLBCL, diffuse large B-cell lymphoma; MCL, mantle cell lymphoma.