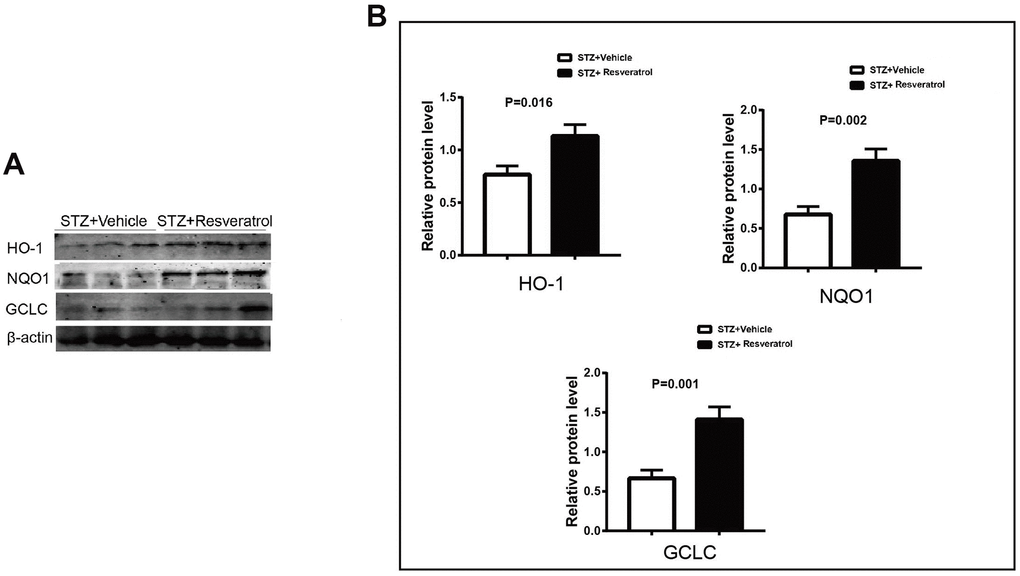
Figure 4.(A, B) Western blot analyses of lysates of HO-1, NQO1, GCLC from STZ+Vehicle and STZ+Resveratrol mice using the indicated antibodies at 12 weeks after STZ injection (n = 3 nerves for each group, data are represented as the mean ± SEM).
Figure 4 — Anti-inflammatory effect of resveratrol attenuates the severity of diabetic neuropathy by activating the Nrf2 pathway | Aging