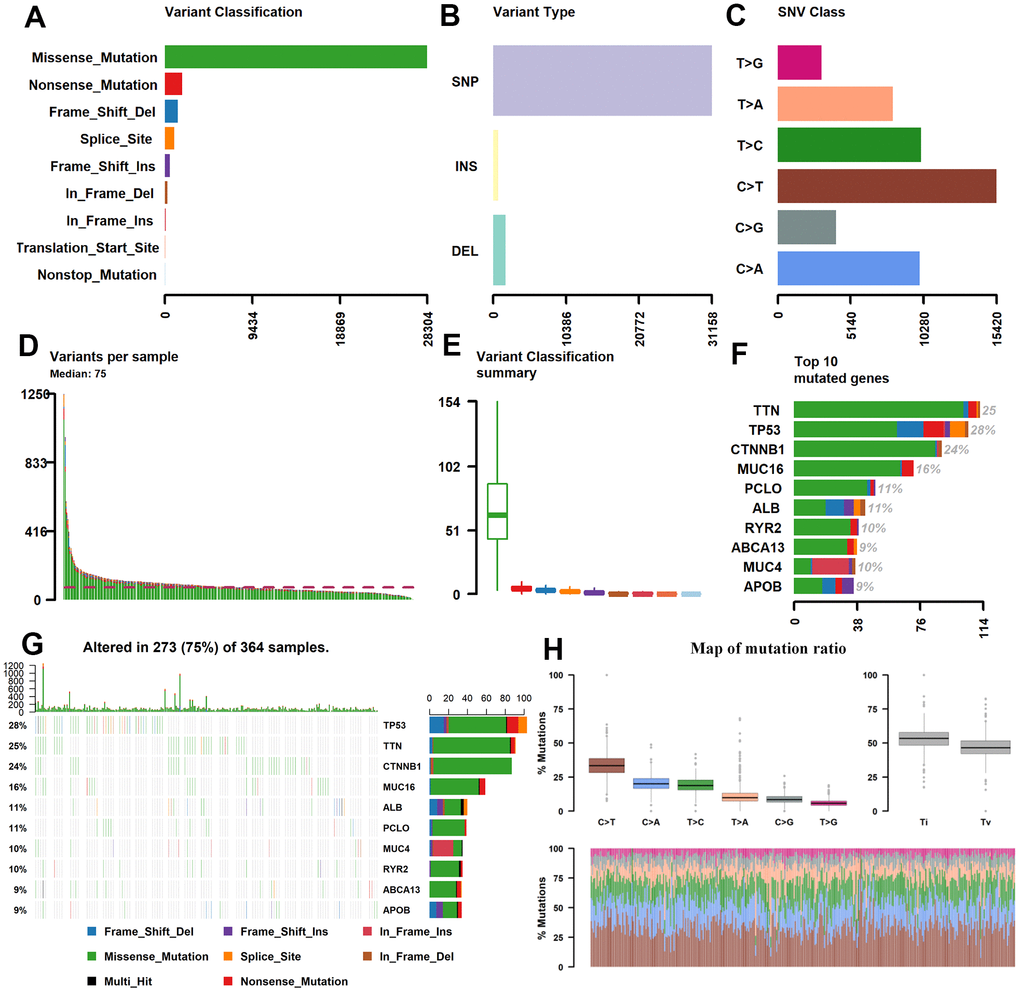
Figure 1.Statistics of mutation information in the HCC samples. (A–C, H) Statistical results of the different mutations, in which missense mutation occupied the most mutation classifications, SNP accounted for the main mutation type, and C>T was the main SNV Class. (D, E) Statistics of tumor mutations in each sample and different colors represent the different mutation types as shown in Figure 1A. (F) Statistics of different mutations in the top 10 hyper abrupt genes and different colors represent different mutation types. (G) The mutation status of the top 10 hyper abrupt genes: the X-axis is the sample, the Y-axis is the hyper abrupt gene, and different colors represent different mutation types. HCC, hepatocellular carcinoma; SNP, single nucleotide polymorphism; SNV, single nucleotide variants.
Figure 1 — Prognostic analysis of tumor mutation burden and immune infiltration in hepatocellular carcinoma based on TCGA data | Aging