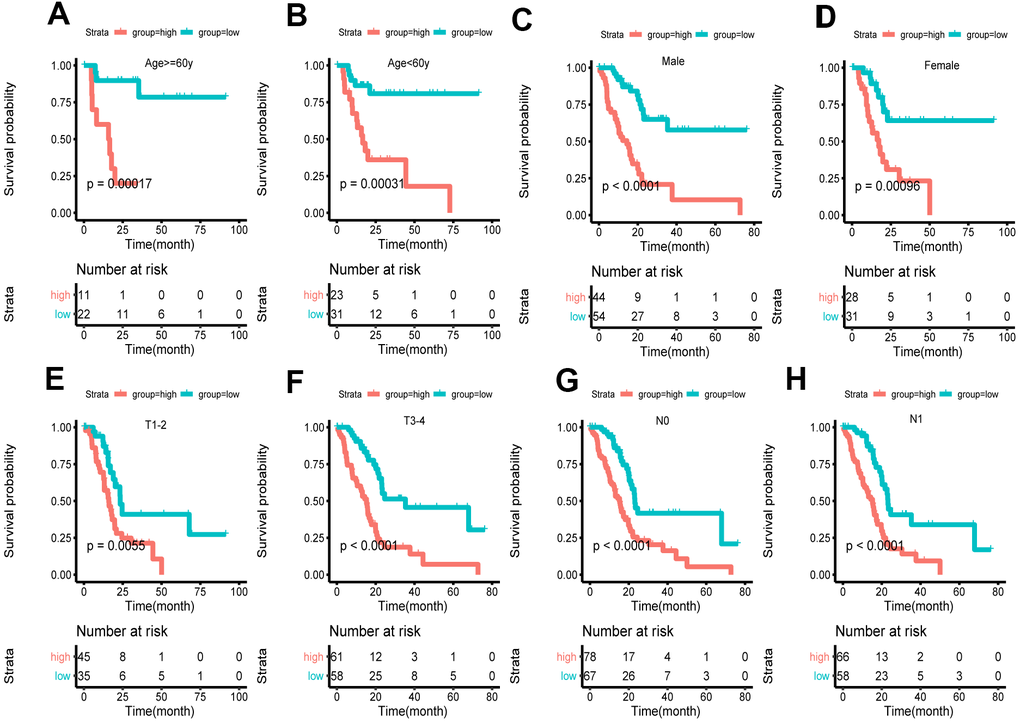
Figure 5.Survival of the FRG signature in patients stratified by gender, age and tumor stage. (A, B) The difference in OS between high- and low-risk group stratified by age. (C, D) The difference in OS between high- and low-risk group stratified by gender. (E, F) The difference in OS between high- and low-risk group stratified by T stage. (G, H) The difference in OS between high- and low-risk group stratified by N stage. (E, F) According to tumor node metastasis classification. T, tumor; N, node.