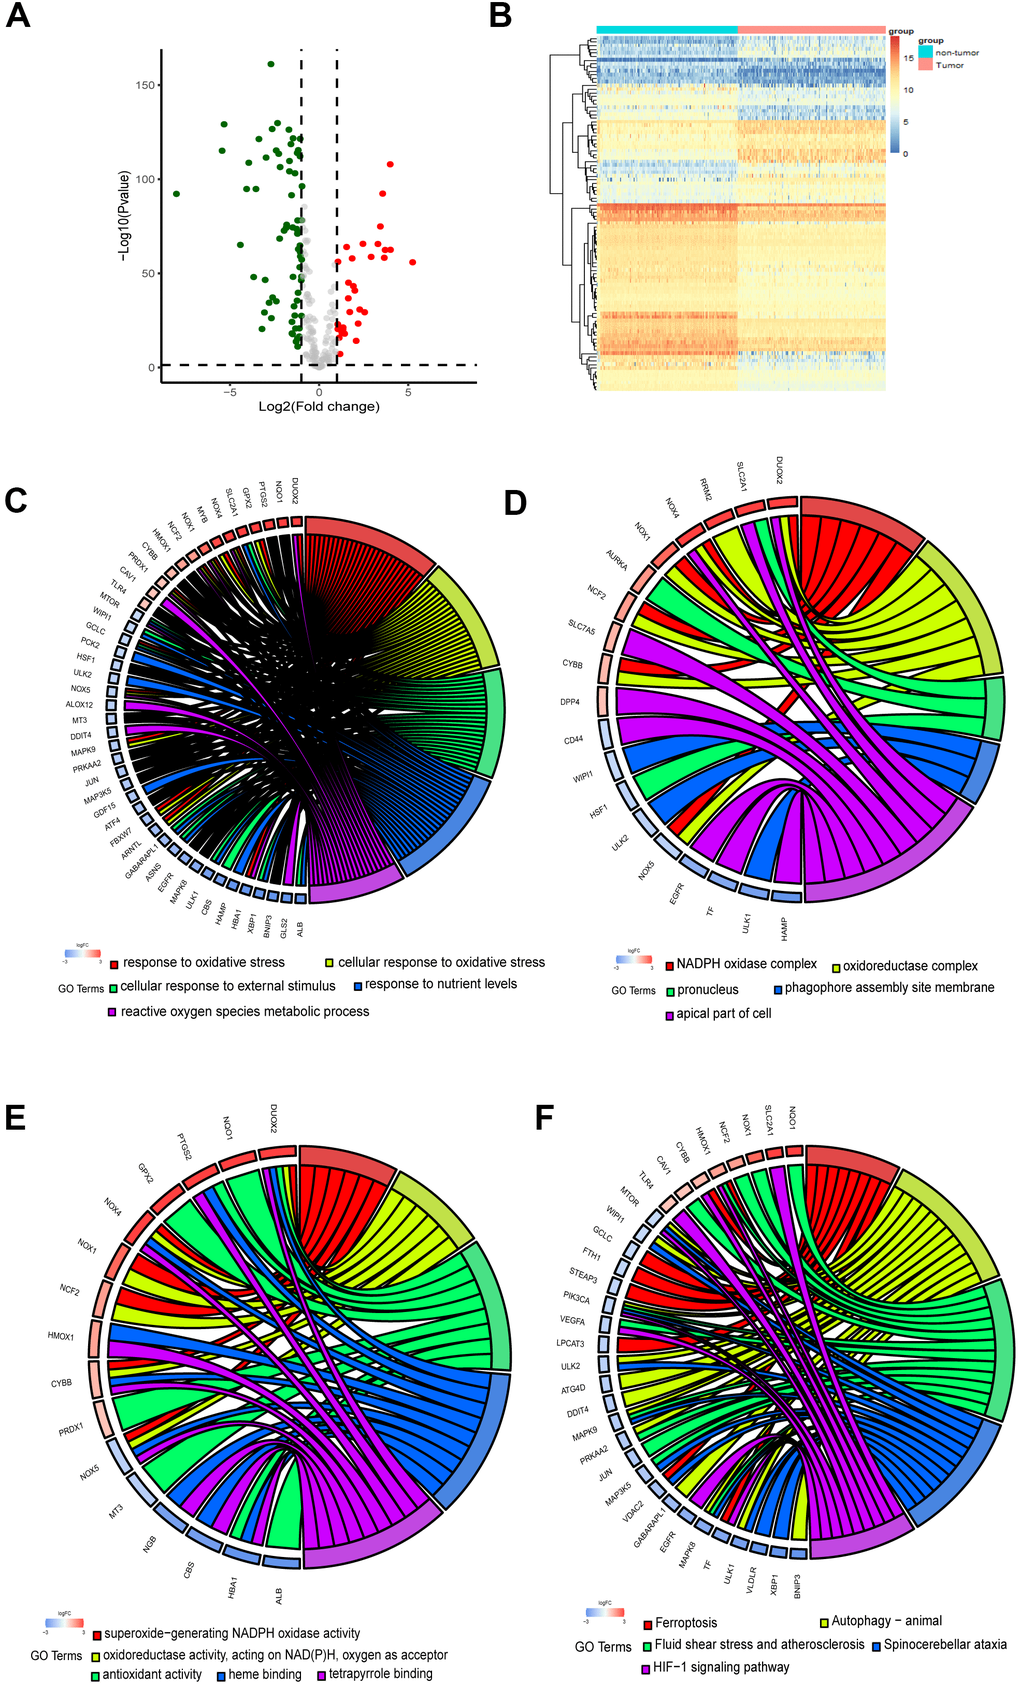
Figure 2.Identification and functional enrichment analysis of the ferroptosis-related DEGs. (A) Volcano plot of DEGs. Red dots represented up-regulated genes while green dots represented down-regulated genes, and black dots represented no differences gene. (B) Heatmap of DEGs to visualize the expression levels of genes. (C–F) Chord plot depicting the relationship between DEGs and GO in terms of the biological process, cellular component, molecular function and KEGG pathways.