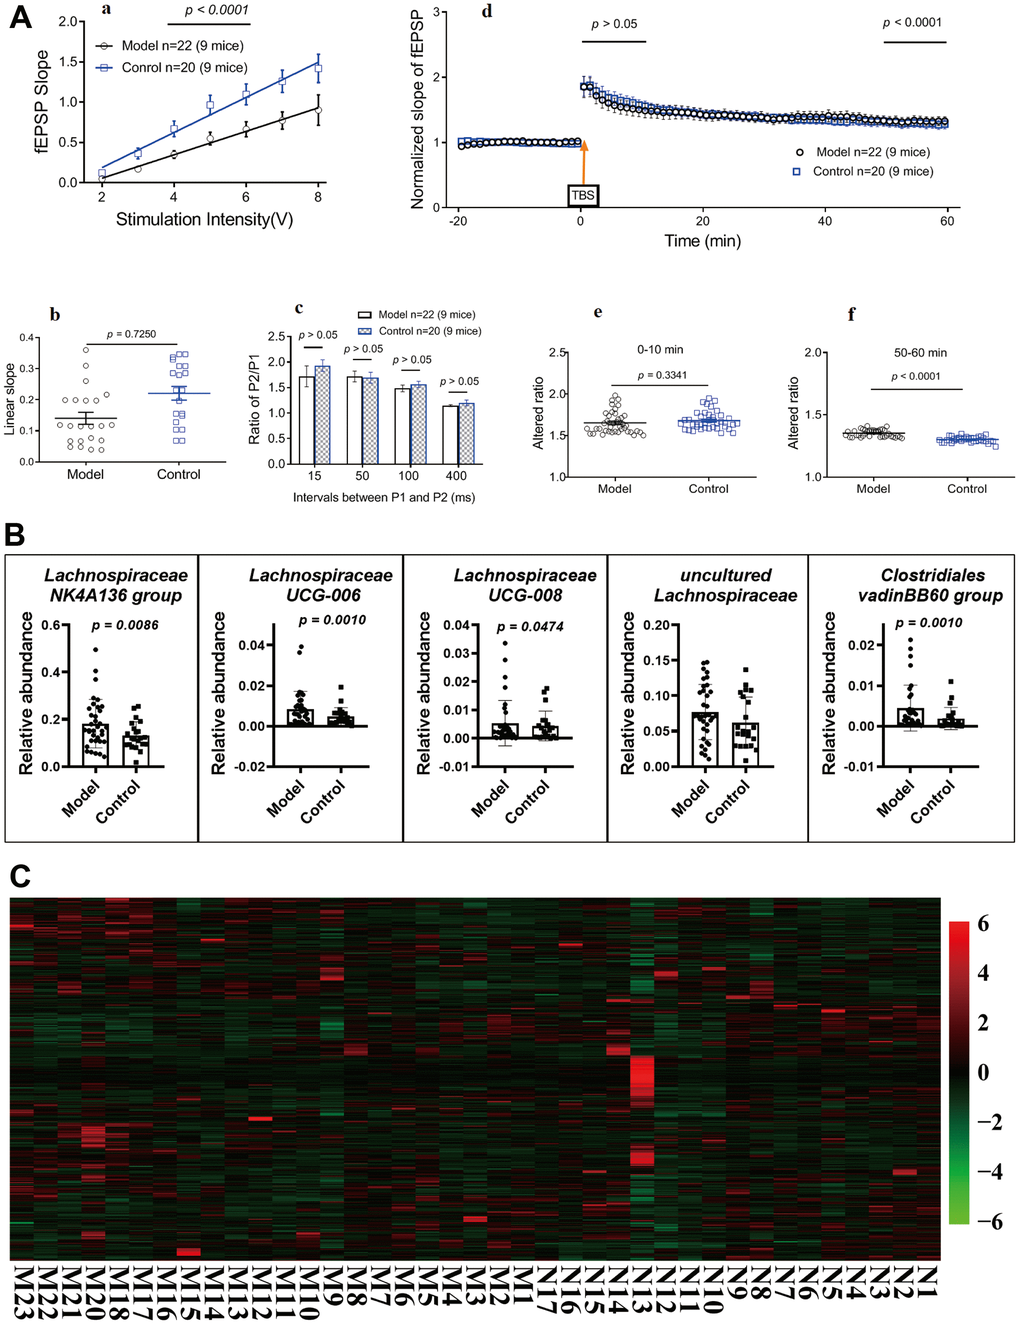
Figure 3.Influences of maternal high sugar and fat diet on LTP, gut microbiota and metabolome of older mice. (A) LTP in hippocampal slices, 16 months later, subsets of mice were randomly selected to perform standard field potential recordings. (B) Changes on the gut microbiota; (C) Changes on the metabolome in fimo. The pathological structure of brain and small intestine (Supplementary Figure 5). Data are presented as the means ± SD of more than 6 independent experiments. Significant differences between two groups of LTP were evaluated by two-tailed unpaired Student’s t-tests or two-tailed Welch’s t-test. Significant differences between treatments were analyzed by one-way analysis of variance (ANOVA) at p < 0.05.