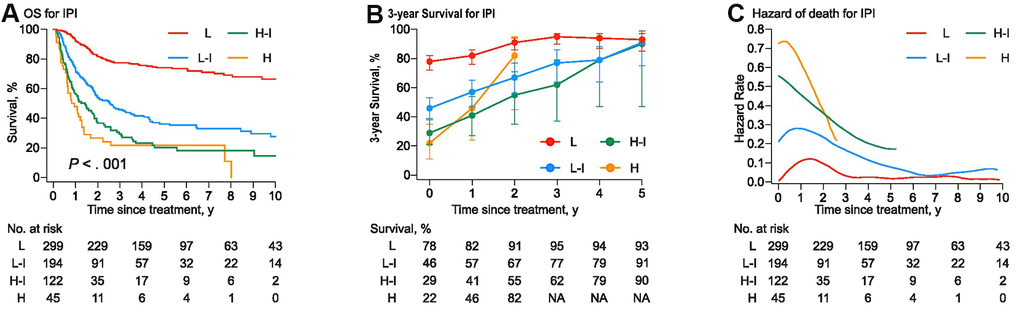
Figure 3.(A) The overall survival curves were stratified into four groups by the International Prognostic Index (IPI). (B) Three-year conditional survival with error bars of 95% CIs for patients who have survived for 1 year, 2years, 3 years, 4 years, and 5 years from the time of treatment. (C) Smoothed hazard plots for the annual rate of death since treatment.