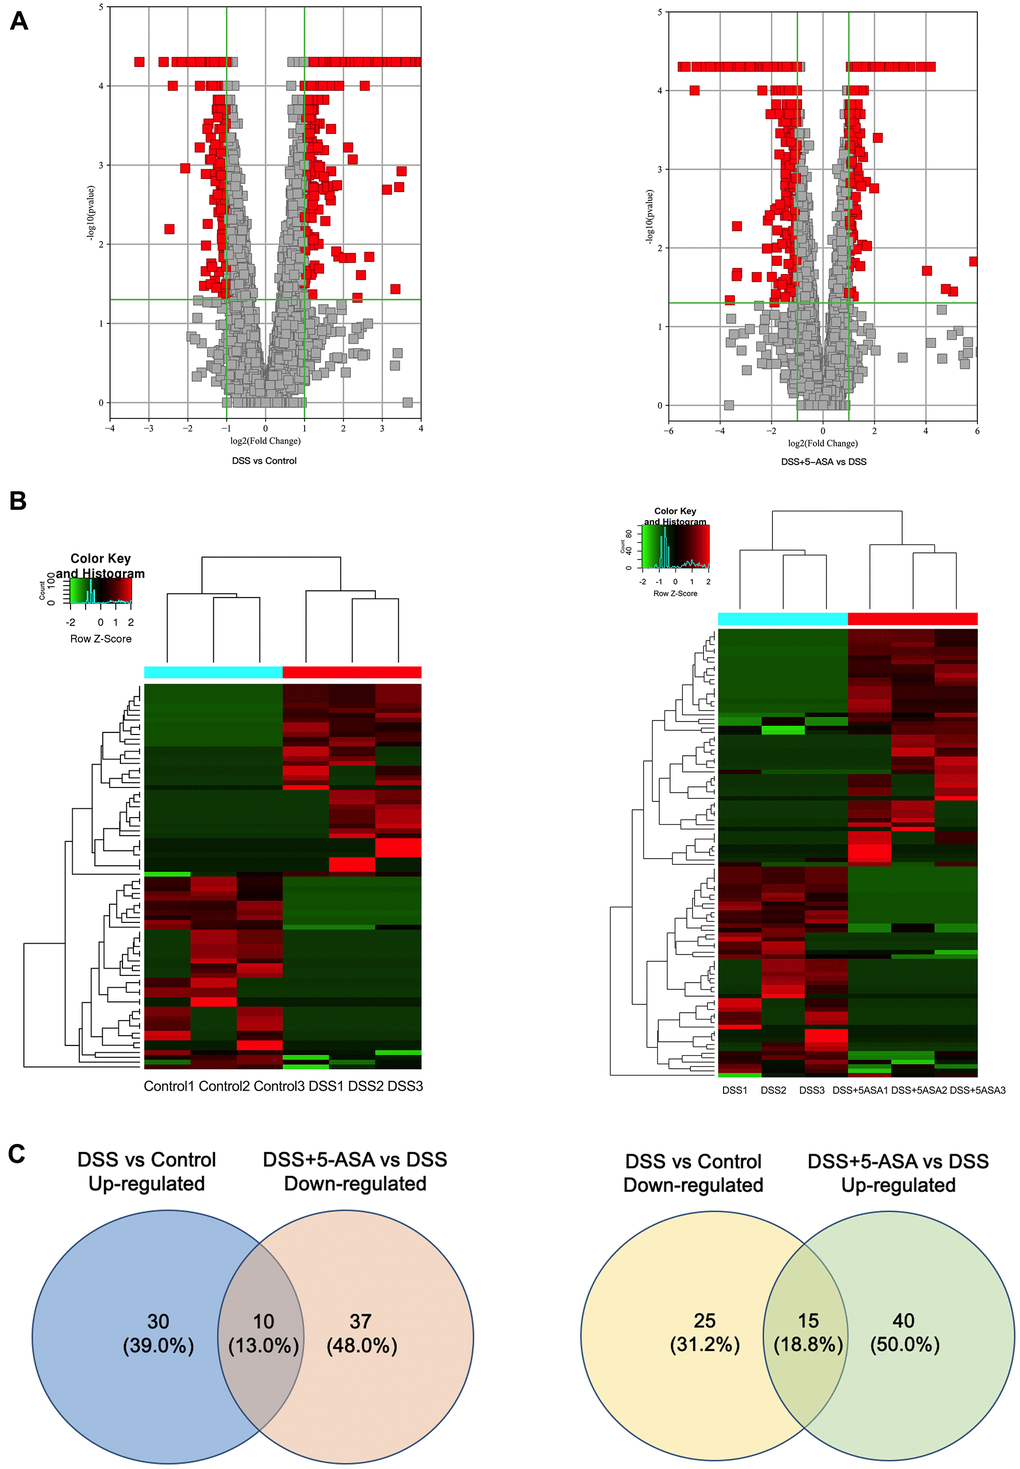
Figure 3.Bioinformatic analysis of the detected circRNAs between DSS vs. control and DSS+5-ASA vs. DSS group. (A) Volcano plot shows the significantly differentially expressed circRNAs in a visible way and the vertical green lines correspond to 2.0-fold up- and down-regulation and the horizontal line represents the 0.05-p-value. (B) Hierarchical clustering was used to evaluate the differentially expressed circRNAs when comparing with each sample of control, DSS and DSS+5-ASA group. Columns indicated the expression pattern of each sample; the green and red line represented the low and high expression level. (C) Venn plot shows the number of the dysregulated circRNAs in DSS vs. control and DSS+5-ASA vs. DSS group.