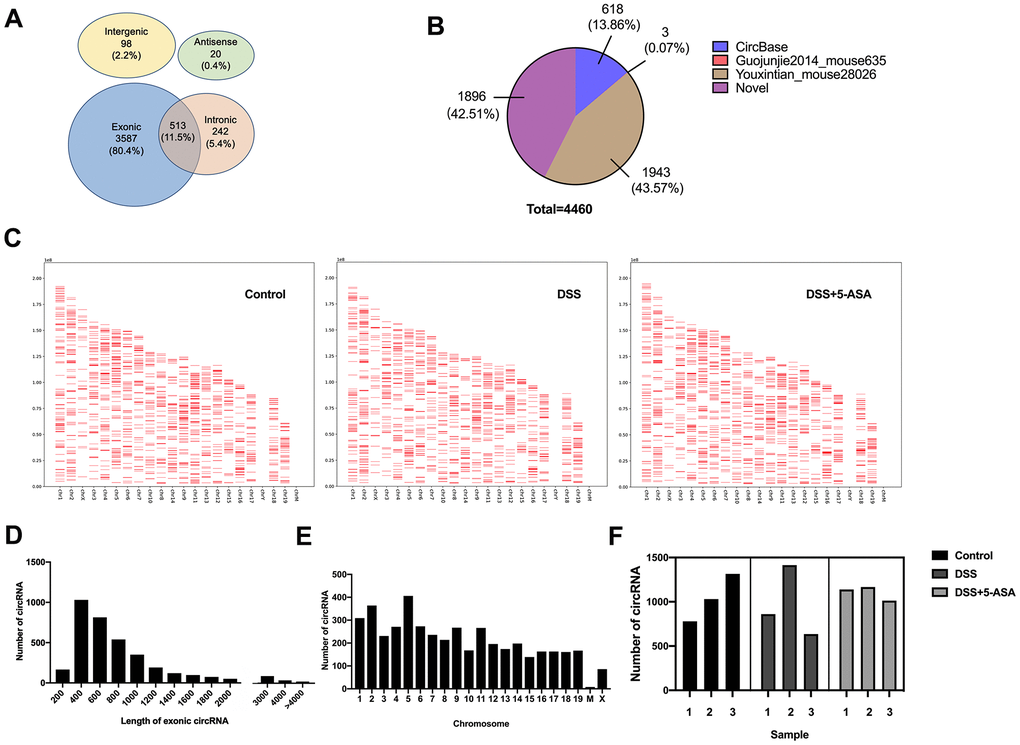
Figure 2.Expression profiling of circRNAs in DSS-induced and mesalazine-treated IBD by RNA-seq. (A) Venn plot was used to show the different genomic locations of the detected circRNAs. (B) Pie graph was conducted to exhibit the source of the detected circRNAs. (C) Positions and densities of the detected circRNAs. X-axis: distributed chromosome. Y-axis: the length of chromosome. The short red lines represent the position and density of these circRNA on the chromosome. (D) Length of all exonic circRNAs. X-axis: length of exonic circRNAs. Y-axis: the number of exonic circRNAs of different length. (E) Chromosomal distribution of the detected circRNAs. X-axis: distributed chromosome. Y-axis: the number of circRNAs of different chromosome. (F) The number of detected circRNAs in each group.