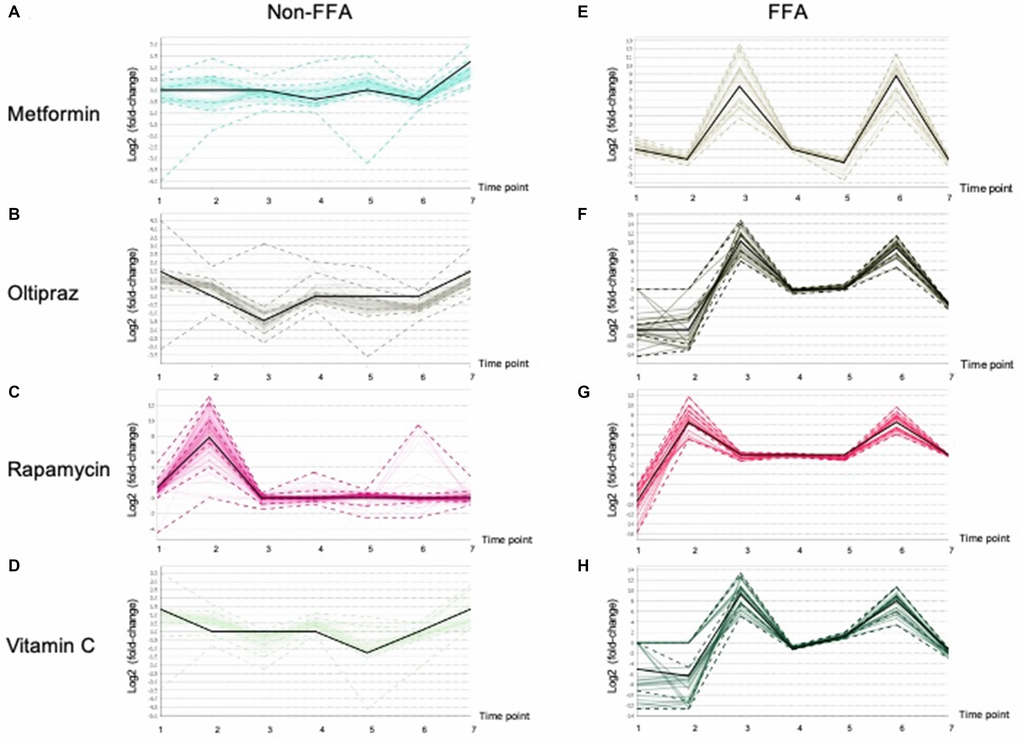
Figure 6.Patterns of the Lipid fluctuation in drug treatment cells along 7 time points, and each data point is the log2 (fold-change) of a lipid between a drug and control. The black line shows the overall trend of the cluster. (A), (B), (C), (D) showed the trends of non-FFAs in cells treated by Metformin, Oltipraz, Rapamycin and Vitamin C, respectively. (E), (F), (G), (H) presented the trends of FFAs in cells treated by Metformin, Oltipraz, Rapamycin and Vitamin C, respectively.