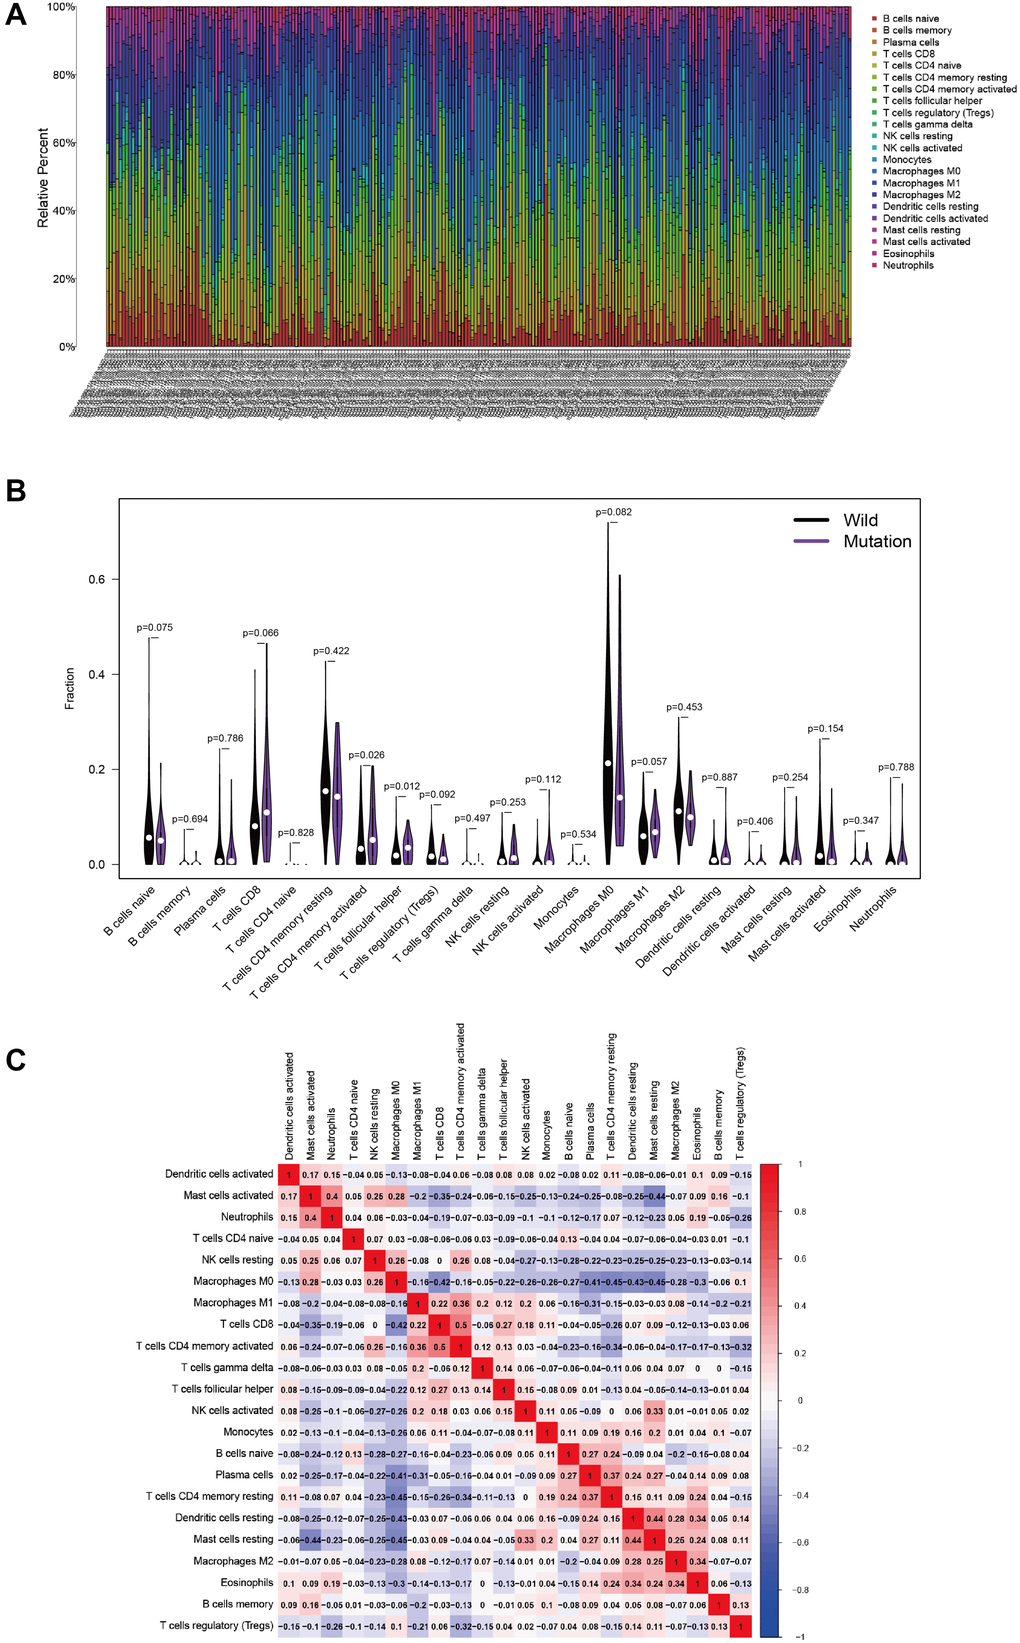
Figure 6.MUC4 mutation is correlated with tumor-infiltrating immune cells. (A) The stacked bar chart shows the distribution of 22 immune cells in each sample. (B) Violin plot displaying the differentially infiltrated immune cells between the MUC4-mutant groups and the wild-type MUC4 group. black represents the wild-type MUC4 group, and purple represents the MUC4-mutant group. The p-value is shown in the figure. (C) Correlation matrix of immune cell proportions. The red color represents a positive correlation, and the blue color represents a negative correlation.