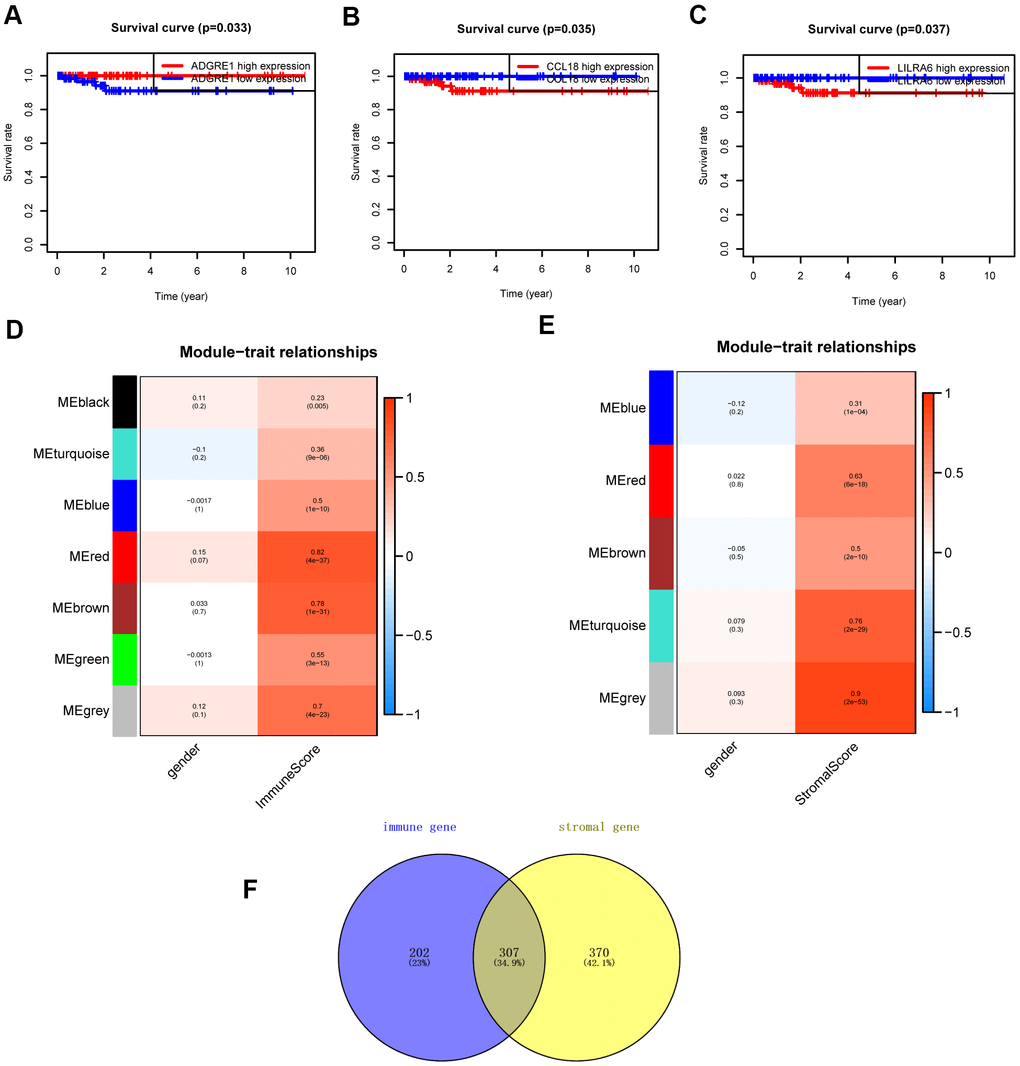
Figure 4.Survival analysis and module-trait relationship analysis. (A–C) Overall survival between patients with high and low expression of the three hub genes. (D) Heatmap of the correlation between module eigengenes and immune score. (E) Heatmap of the correlation between module eigengenes and stromal score. (F) Venn plots displaying the intersection genes.