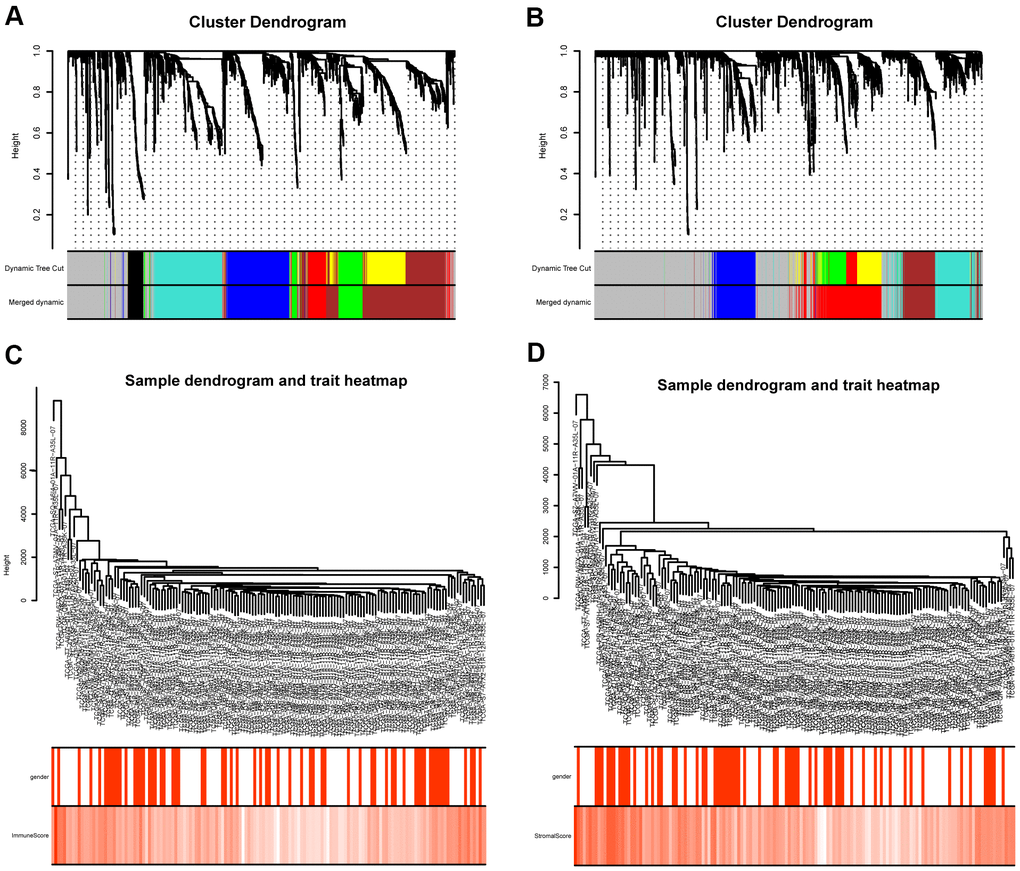
Figure 3.Gene coexpression module analysis. (A) Gene dendrogram and identified coexpression modules of DEGs between high- and low- immune score groups. (B) Gene dendrogram and identified coexpression modules of DEGs between high- and low- stromal score groups. (C) Sample dendrogram and trait heatmap of DEGs between high- and low- immune score groups. (D) Sample dendrogram and trait heatmap of DEGs between high- and low- stromal score groups.