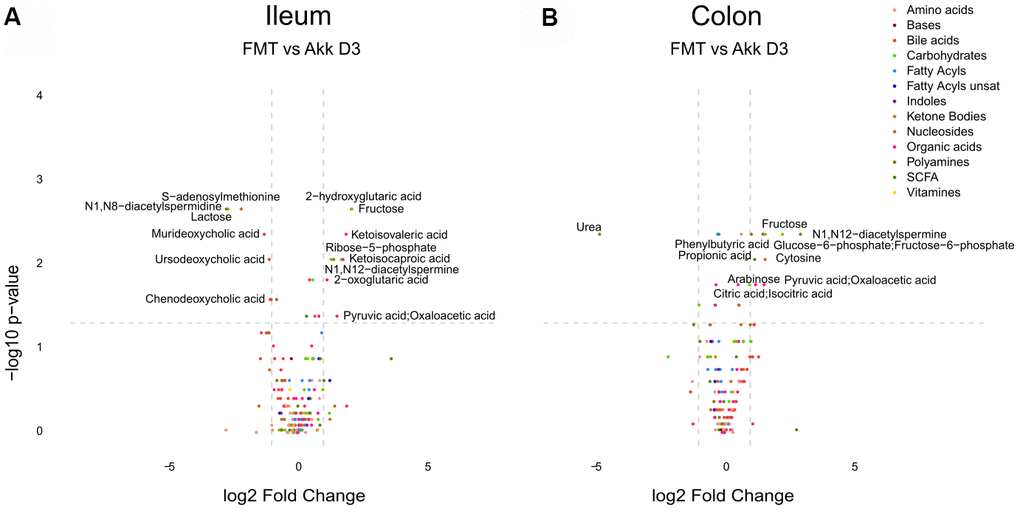
Figure 4.Differential metabolite identification in samples from ileum (A), or colon (B) from mice receiving FMT or Akk at day 3 after the first oral gavage. The horizontal dashed gray line shows where p=0.05 with points above being metabolites with significantly different relative abundance (p<0.05). The vertical dashed gray lines correspond to FC=1. Targeted metabolites that display both large magnitude FC and higher statistical difference (-log10 of p value) are annotated. Families of metabolites are grouped by colors.