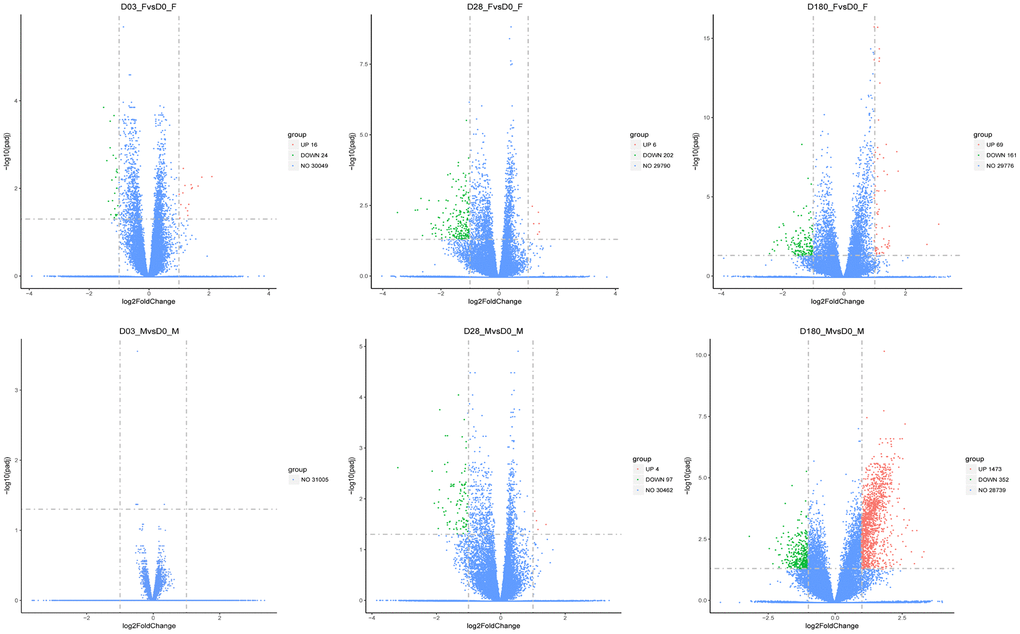
Figure 4.The volcano plots of DGEs in females and males compared with the baseline (Day 3, Day 28, and Day 180). The red dots represented upregulated genes, and the blue dots represented genes with no significant change, while the green dots represented downregulated genes. The threshold was set with rigorous value for the FDR (false discovery rate, padj) < 0.05 and |log2fold change| > 1. The x-axis denoted the fold changes of gene expression relative to baseline, shown with log2|fold change|. The y-axis indicated the significance of DEGs.