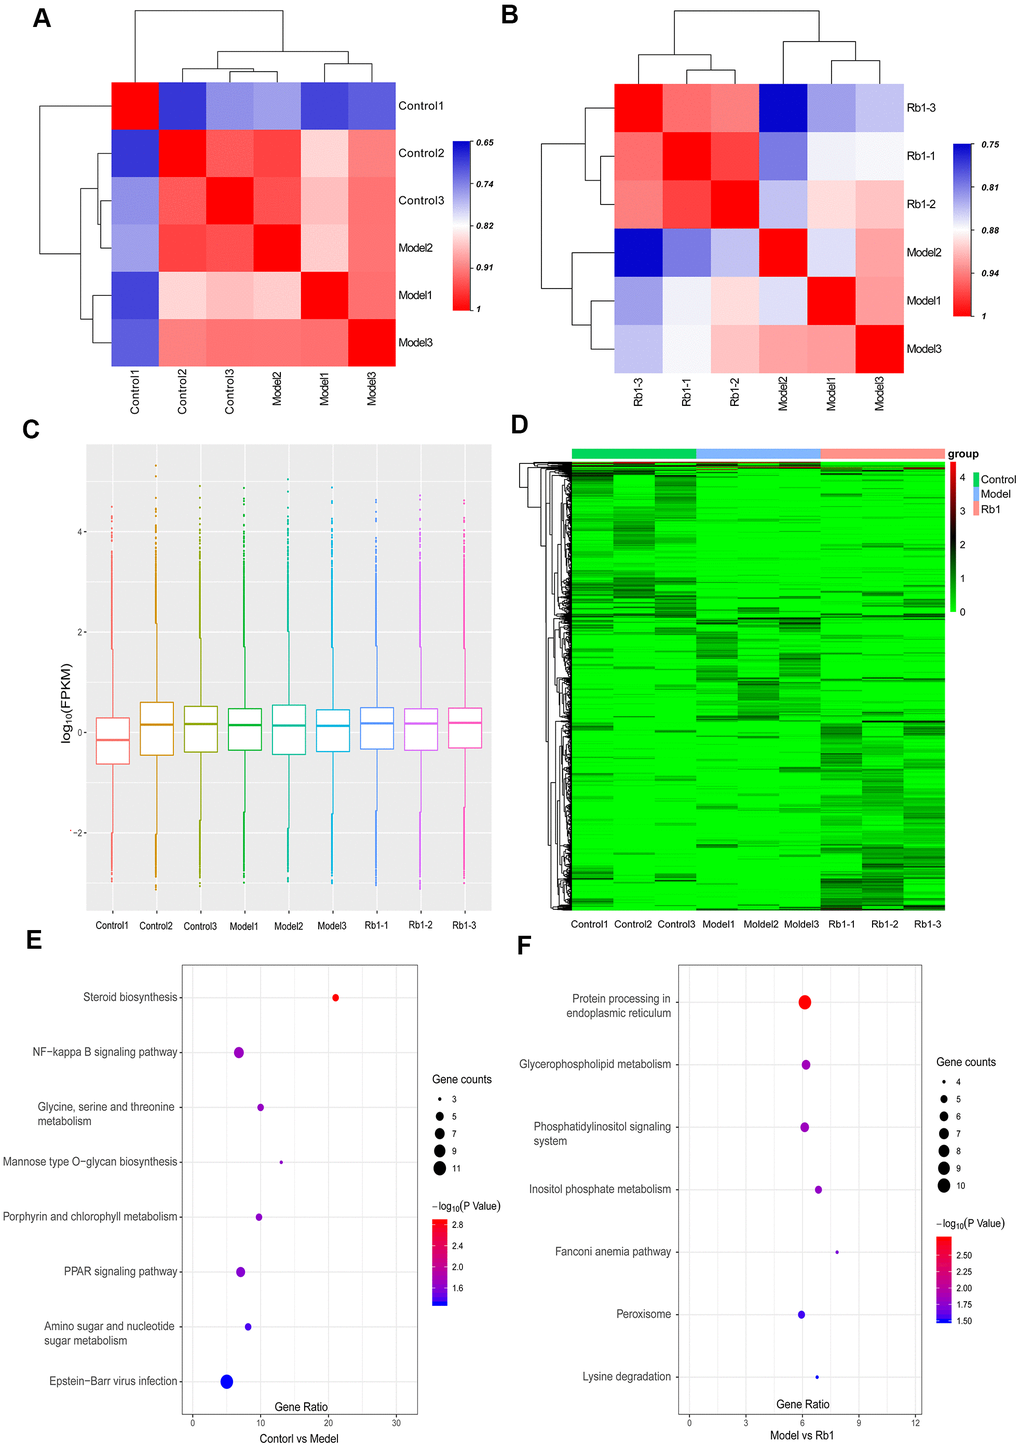
Figure 3.Characteristics of transcriptomics. (A) Heat map of intersample correlation between model and control group. The correlation was evaluated by Pearson’s correlation coefficient, different color represents differences among different samples. (B) Heat map of intersample correlation between Rb1 and model group. (C) FPKM distribution boxes of transcripts in each sample. Y axis is shown in log10 scale, X axis one sample per region. (D) Clustering map of differential genes. The depth of the color represents the level of gene expression. (E) KEGG pathway analysis of differentially expressed genes in control group versus model group. Gene ratio represents enrichment factor, bubble scale represents number of different genes, depth of bubble color represents P value. (F) KEGG pathway analysis of differentially expressed genes in Rb1 group versus model group.