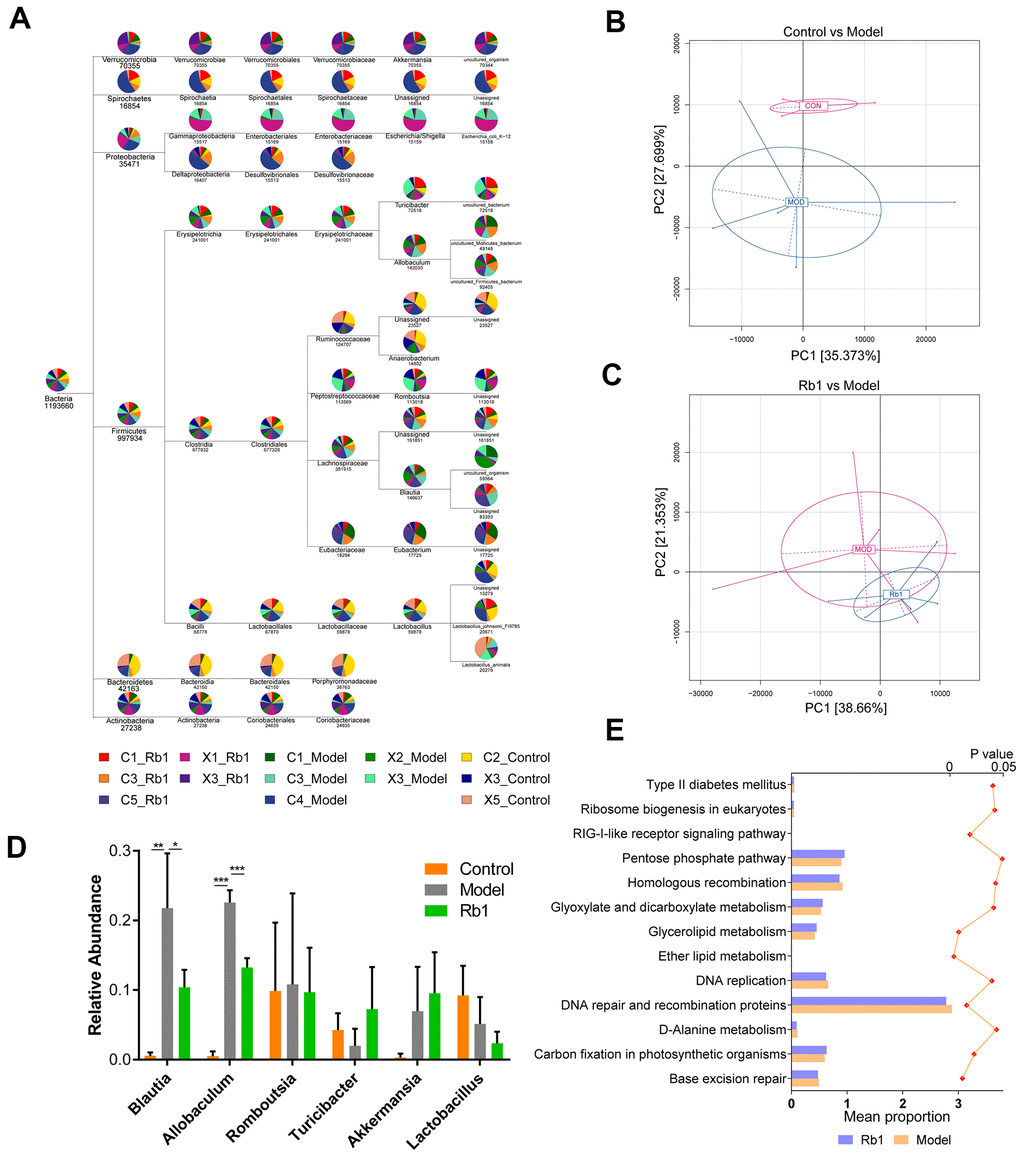
Figure 1.Characteristics of 16S rRNA sequencing. (A) TaxonTree revealed the distribution of each species in all samples. Each layer in the leaf node represents a classification level, from left to right is the boundary, gate, class, order, family, genus and species level, only genus annotated and with relative abundance large than 1% was shown in the figure. (B) PCA of OUT between Control and Model group. Each point in the graph represents a sample. The different colors of the points represent the grouping of the samples. (C) PCA of OUT between Rb1 and Model group. (D) Relative abundance of bacteria in genus level in each group. Blautia and Allobaculum increased in Model group and Turicibacter decreased in Model group. Notes: data was shown in mean +/- SD, * represent P<0.05, ** represent P<0.01, *** represent P<0.001. (E) KEGG analysis of abundance difference between Rb1 and model group. The result was performed by PICRUSt software with default parameters. Each color represents a group of samples, their average relative abundance is showed in X axis. The left of bar chart shows the pathways with significant differences in abundance between the two groups, and the right of chart shows P value of each pathway.