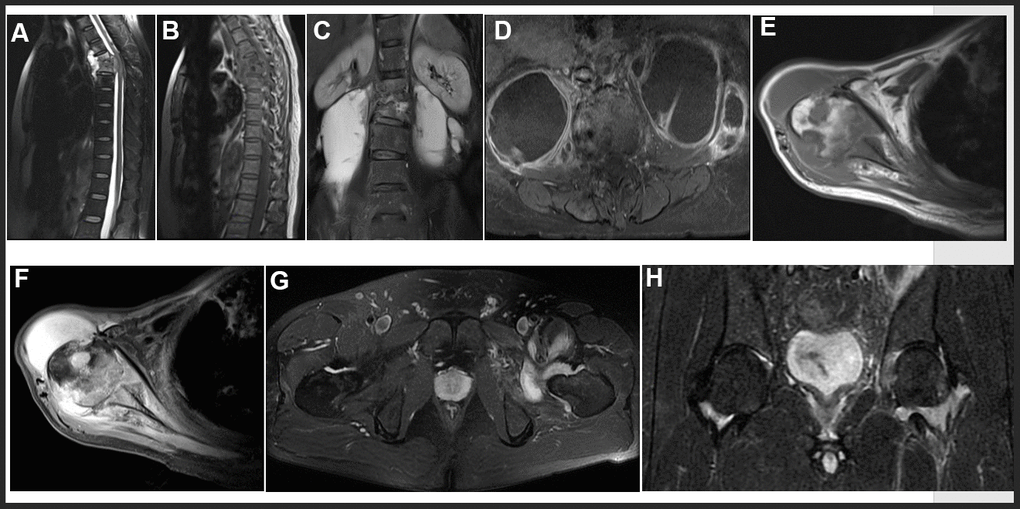
Figure 3.Representative examples of MRI in OTB patients. (A, B) Thoracic spine tuberculosis: showing destruction of vertebral and paravertebral abscess. (C, D) Lumbar spine tuberculosis: showing destruction of vertebral and psoas abscess. (E, F) Right shoulder tuberculosis: showing worm like destruction of the right humeral head with effusion in the articular cavity. (G, H) Left hip joint tuberculosis: showing left hip joint synovitis and synovial fluid.