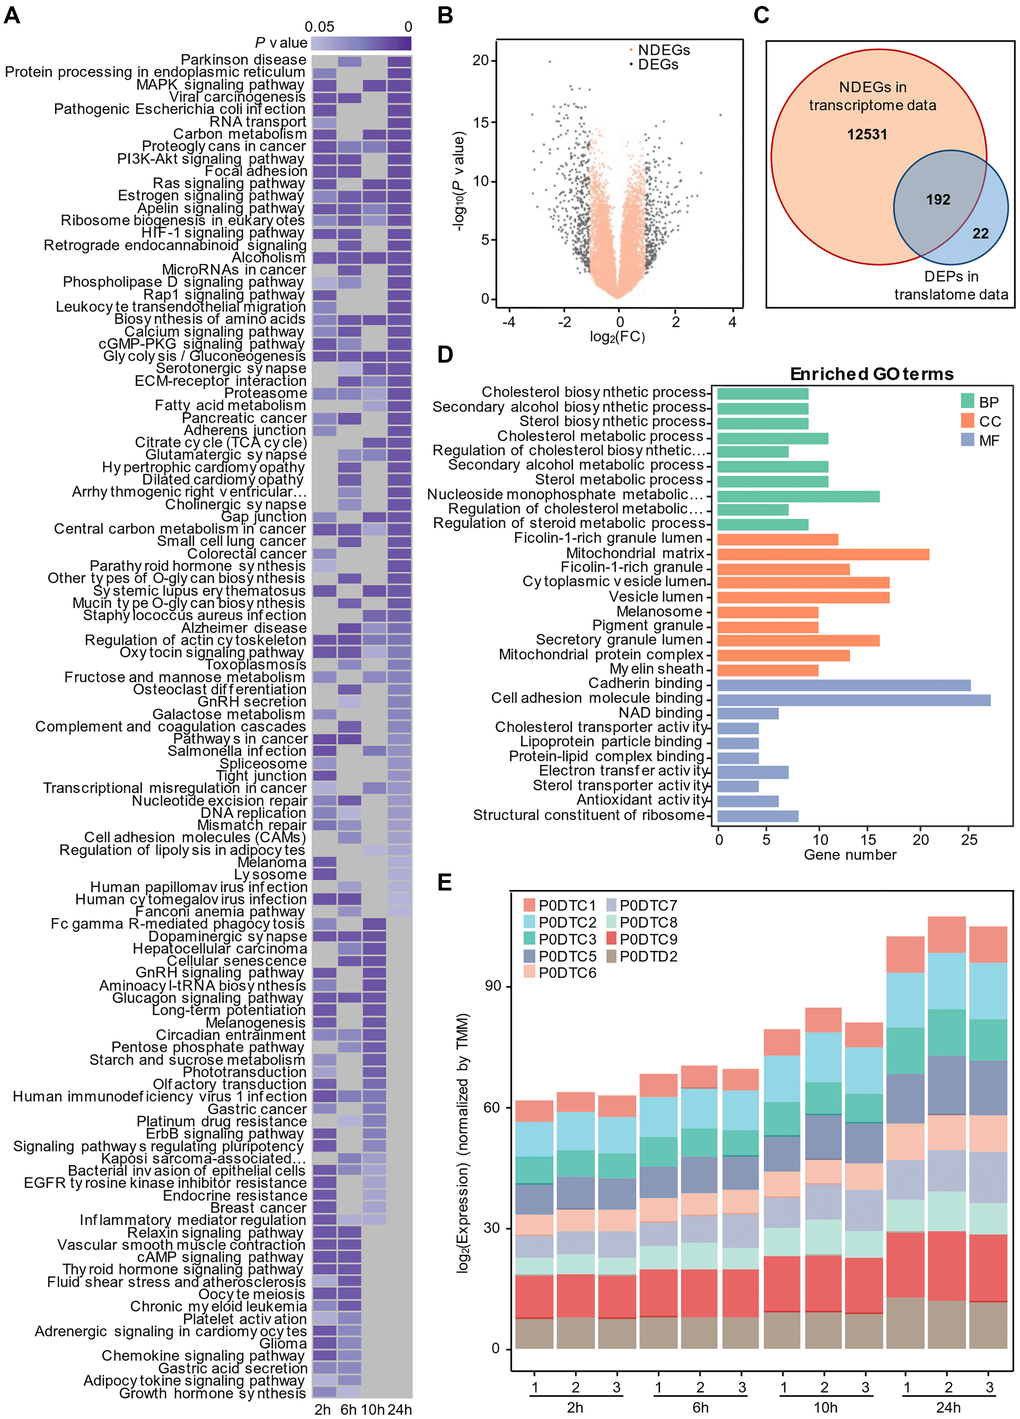
Figure 1.Time-resolved multiomics profiling of the cellular response to SARS-COV-2 infection. (A) Gene set enrichment analysis by time series. Significant KEGG terms (P value < 0.05, n = 3) are presented with a heatmap. Lower P values are shown in dark purple, and higher P values are light purple. Nonsignificant pathways are presented in gray. (B) Volcano plot of non-differentially expressed genes (NDEGs) from SARS-CoV-2-infected cells. The orange dots represent NDEGs with an absolute log2 (fold change) ≤ 1 or a P value ≥ 0.05 (n = 2) compared with the control. For the small sample number, the P value was calculated with Limma-voom R package following the method reported by Ritchie ME et al. [48]. (C) Venn diagram showing the overlap of non-differentially expressed genes (NDEGs) in the transcriptional data and differentially expressed proteins (DEPs) (P value < 0.05 and absolute log2 (fold change) > 1) in the translational data (n = 3). (D) Analysis of GO terms for the 192 proteins shared by NDEGs and DEPs with P value < 0.05. (BP: Biological Process; CC: Cellular Component; MF: Molecular Function) (E) The time-dependent expression of SARS-COV-2 proteins detected by proteomics.