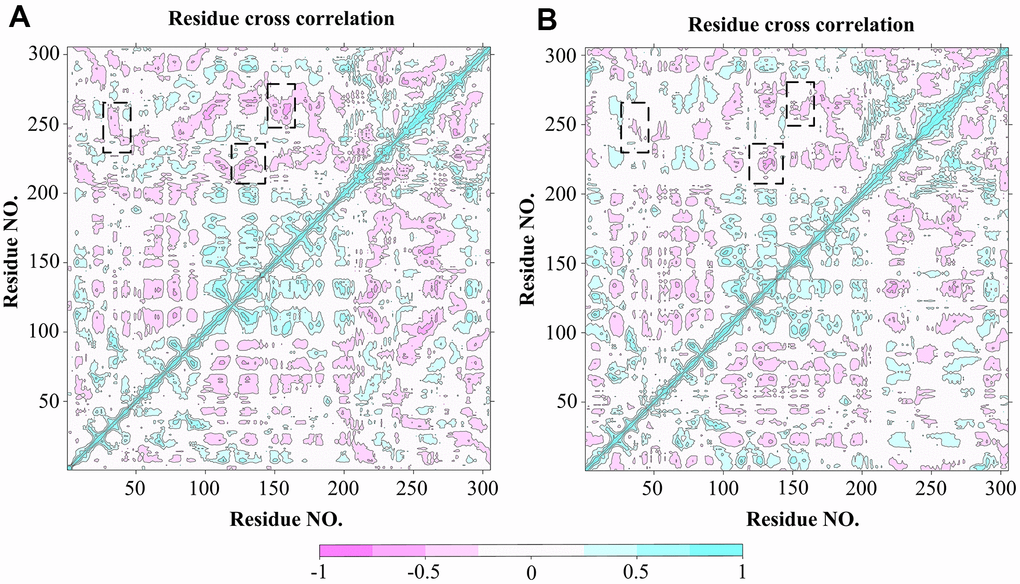
Figure 6.DCCM analysis of Cα atoms for 3CLpro system (A) and 3CLpro-Indinavir system (B), respectively. The red regions indicate negative correlation, and the blue regions indicate positive correlation. The darker the color, the stronger the correlation. Regions with significant differences in correlated motions have been marked with black dashed boxes.