Submit an Article
Navigate
Home
Editorial Board
Editorial Policies
Current Volume
Archive
Scientific Integrity
Publication Ethics Statements
Interviews with Outstanding Authors
Newsroom
Sponsored Conferences
Podcast
Contact
Special Collections
Submit an Article
Online ISSN: 1945-4589
Research Paper
|
Volume 13, Issue 5
|
pp. 6258–6272
Screening potential FDA-approved inhibitors of the SARS-CoV-2 major protease 3CL
pro
through high-throughput virtual screening and molecular dynamics simulation
Back to article
Figure 5
(5 of 7)
−
100%
+
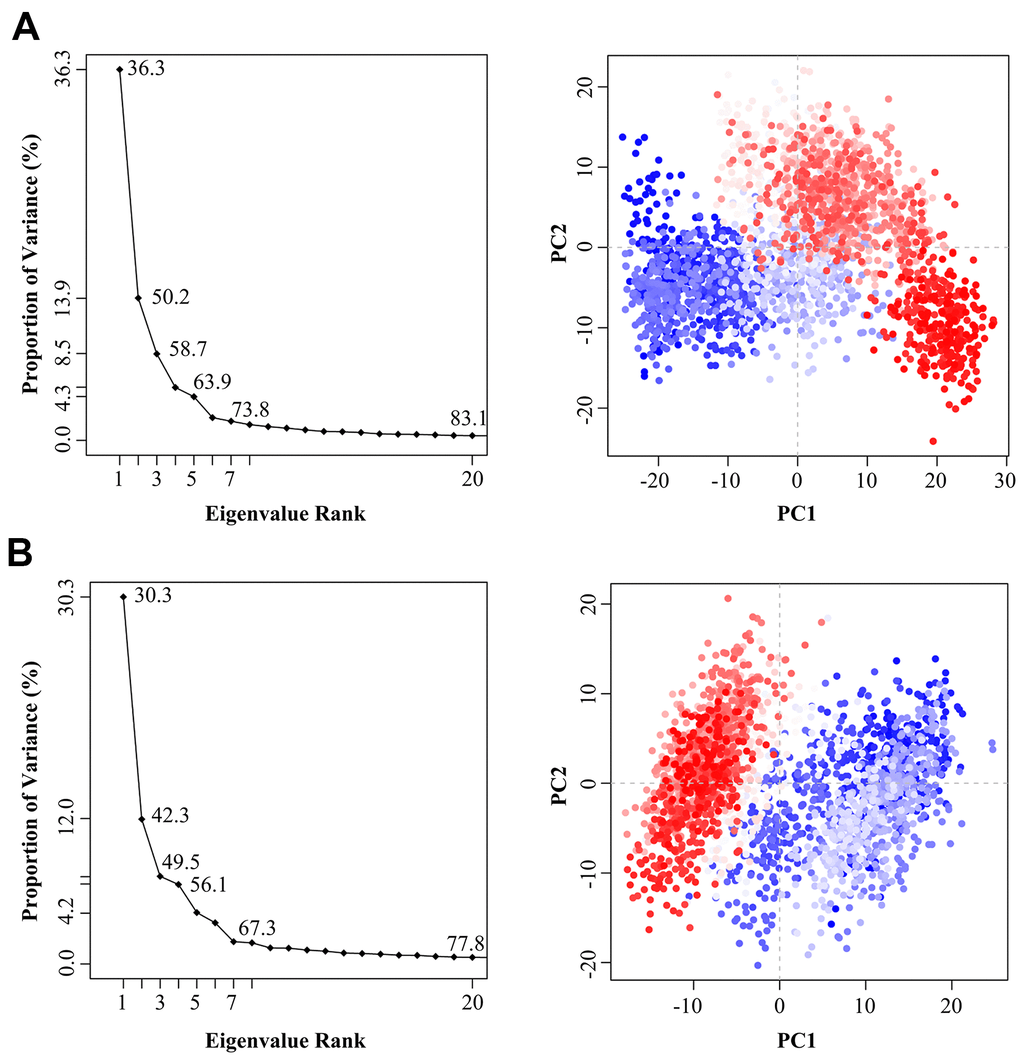
Figure 5.
The variance contribution of the principal components and the PCA scatter plots generated along the projection of the first two eigenvectors (PC1 and PC2) in the space of the 3CL
pro
(
A
) and 3CL
pro
-Indinavir (
B
) systems, respectively.