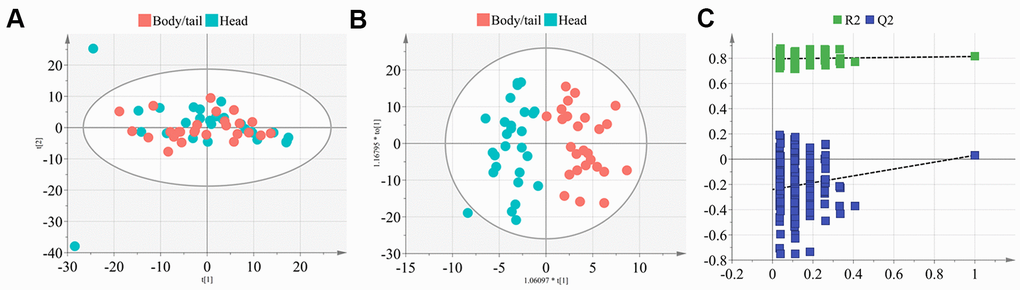
Figure 2.The PCA and OPLS-DA model construction of metabolome signature. (A) The plot depicted the distribution of the pancreatic head and body/neck cancers (n=30 for each group) into seven components with the PCA analysis (cum R2X=0.513, Q2=0.130), after removing the six outliers. (B) Deep mining by OPLS-DA identified an optimized classification (cum R2Y=0.818, Q2=0.031) into three components. (C) Results of the 200 times permutation test of the OPLS-DA model. The blue regression line of the Q2-points intersects the vertical axis below zero indicated the validity of the model.