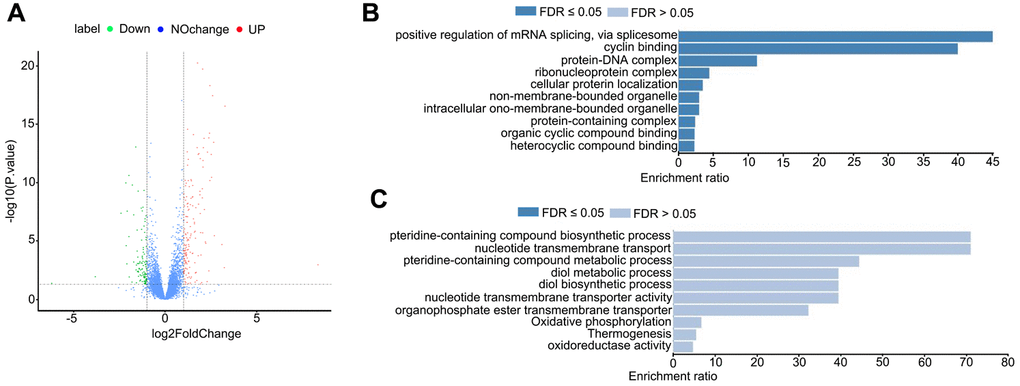
Figure 7.JB-3-22 treatment disrupted the mRNA transcription in porcine oocytes. (A) Volcano plot of differences in gene expression in JB-3-22 treated oocytes. Each point represents one gene. The x-axis represents the delta beta value (control and JB-3-22 group), and the y-axis indicates –log10 of the p-value. (B) The GO analysis of upregulated genes. (C) The GO analysis of downregulated genes.