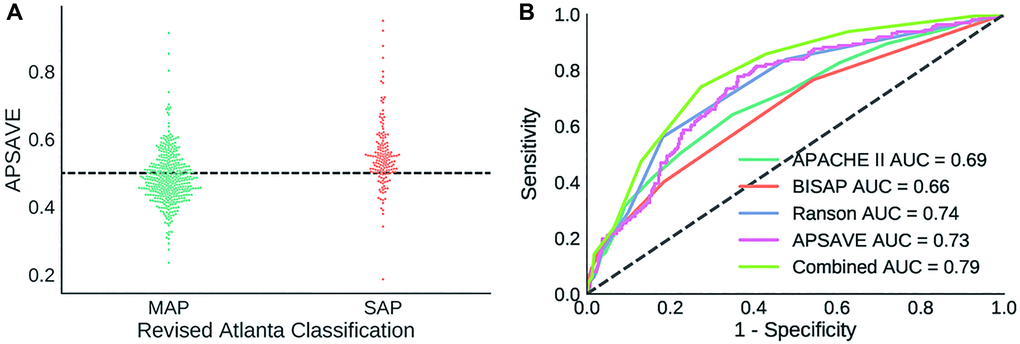
Figure 3.(A) Distribution of APSAVE scores of MAP and SAP cases in the validation cohort; the dashed black line indicates the numeric cutoff of 0.5 to classify an AP case as mild or severe. (B) AUC curves of APSAVE, APACHE II, BISAP, Ranson’s criteria and the combined model (“Combined”) of APSAVE + Ranson’s on classifying AP cases of the validation cohort.