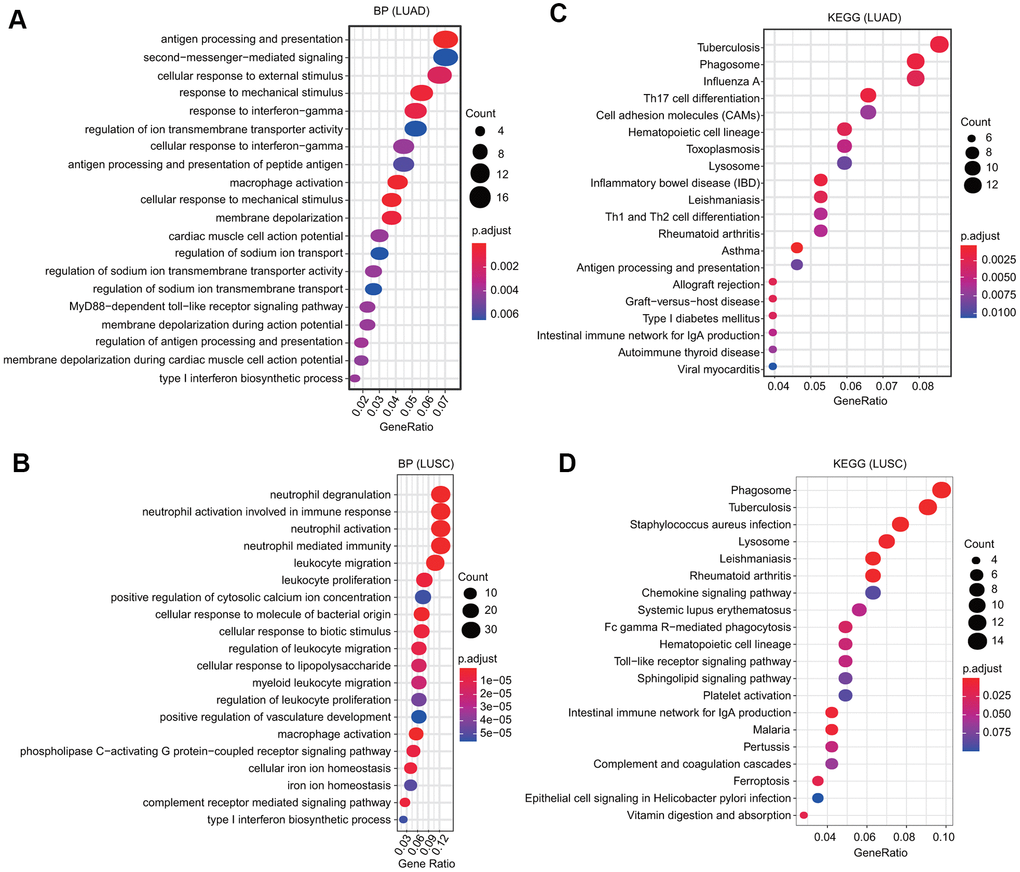
Figure 6.GO and KEGG analyses of FPN1 in lung cancer. (A, B) GO analyses of the biological function of FPN1 in LUAD and LUSC. (C, D) KEGG analyses in LUAD and LUSC. The count represents the number of genes associated with enriched GO or KEGG pathways. The color represents the -log10-transformed P-value.