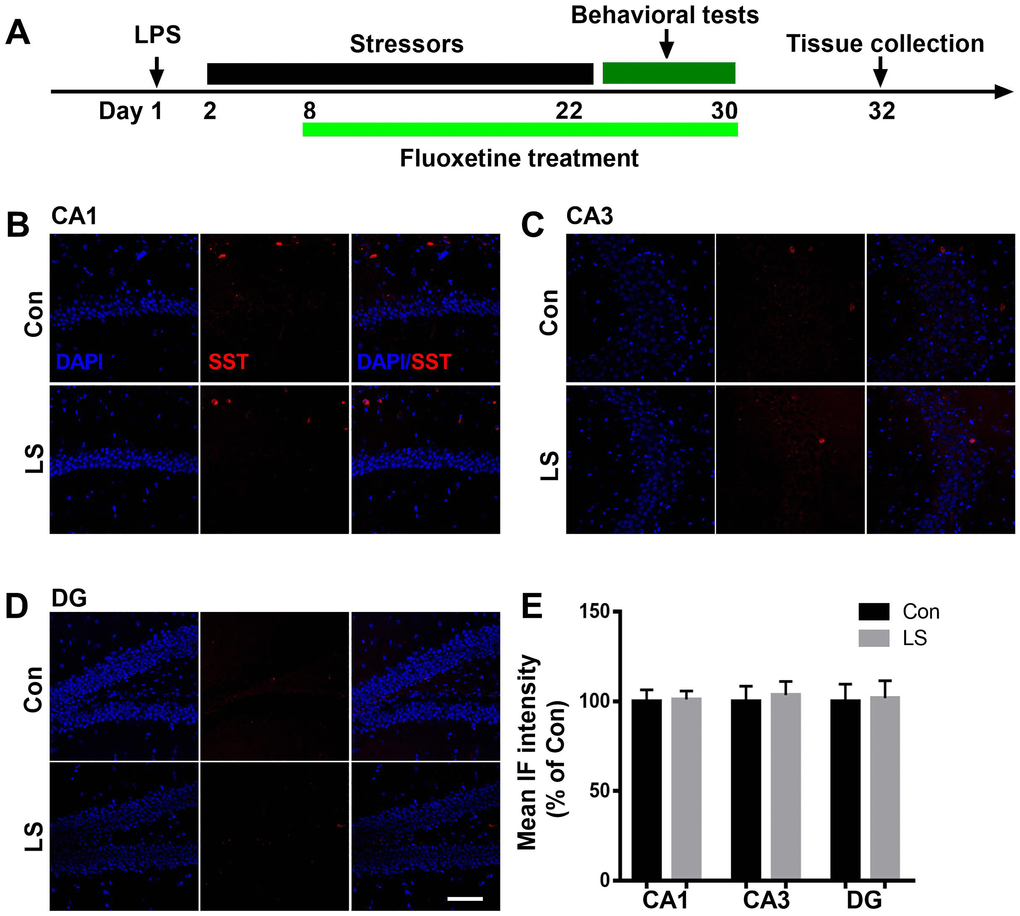
Figure 4.Combined stress did not affect SST level. (A) Schematic timeline of the experimental procedure. (B–D) Representative images of SST interneurons in all subregions of the hippocampus. (E) Quantification of mean SST immunofluorescence in the hippocampus. Data are shown as mean ± SEM (n = 4), scale bar = 100 μm. Con, control; LPS, lipopolysaccharide; Flu, fluoxetine; IF, immunofluorescence; LS, LPS + stress.