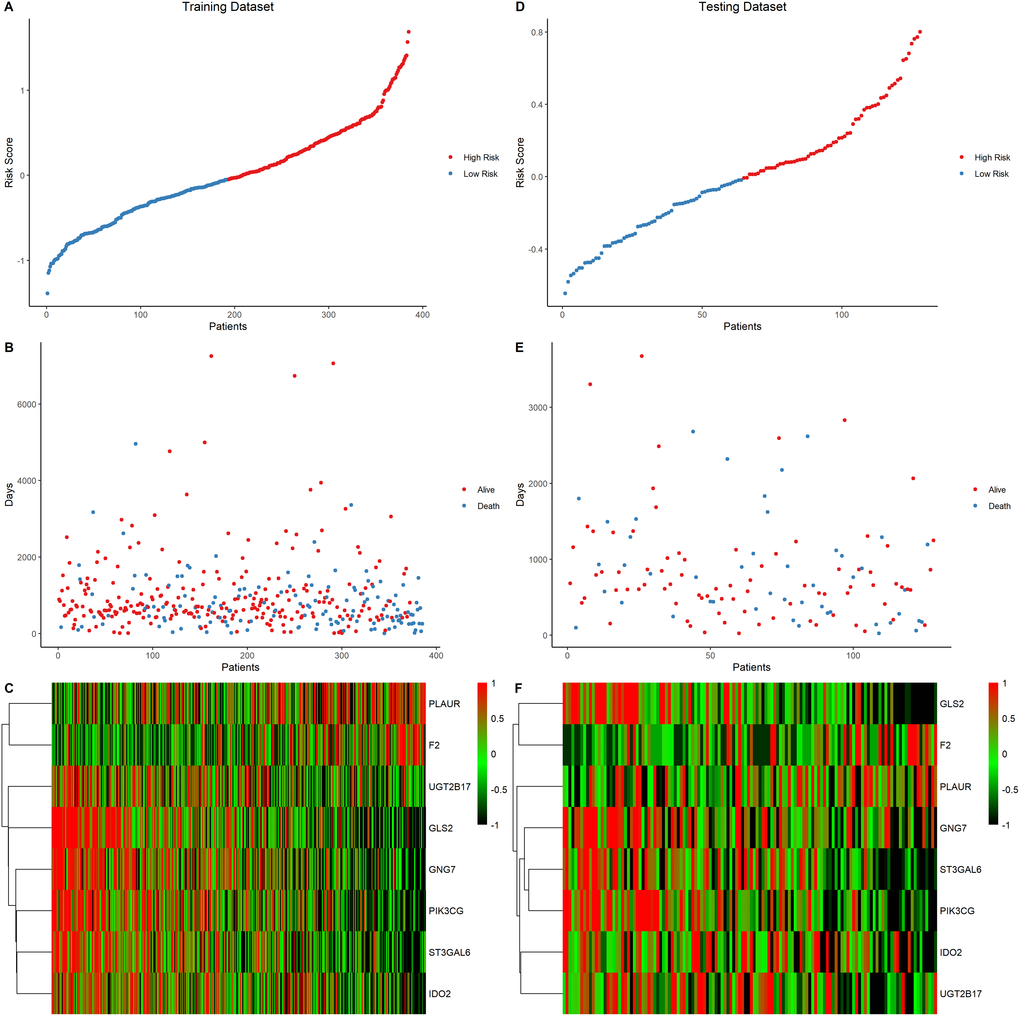
Figure 5.Eight-gene signature predictor score analysis in training and testing data set. (A–C) Training data set, (D–F) Testing data set. The ranked dot plot illustrated the predictor-score distribution of the training data set (A) and testing data set (D). A scatter plot presenting the patients’ overall survival status from training data set (B) and testing data set (E). A heatmap showing the expression profile of the eight signature genes of LUAD patients from training data set (C) and testing data set (F).