Submit an Article
Navigate
Home
Editorial Board
Editorial Policies
Current Volume
Archive
Scientific Integrity
Publication Ethics Statements
Interviews with Outstanding Authors
Newsroom
Sponsored Conferences
Podcast
Contact
Special Collections
Submit an Article
Online ISSN: 1945-4589
Research Paper
|
Volume 13, Issue 6
|
pp. 8620–8627
The whole term efficacy of different treatments in paroxysmal atrial fibrillation in aging: a meta-analysis of randomized controlled trials
Back to article
Figure 2
(2 of 3)
−
100%
+
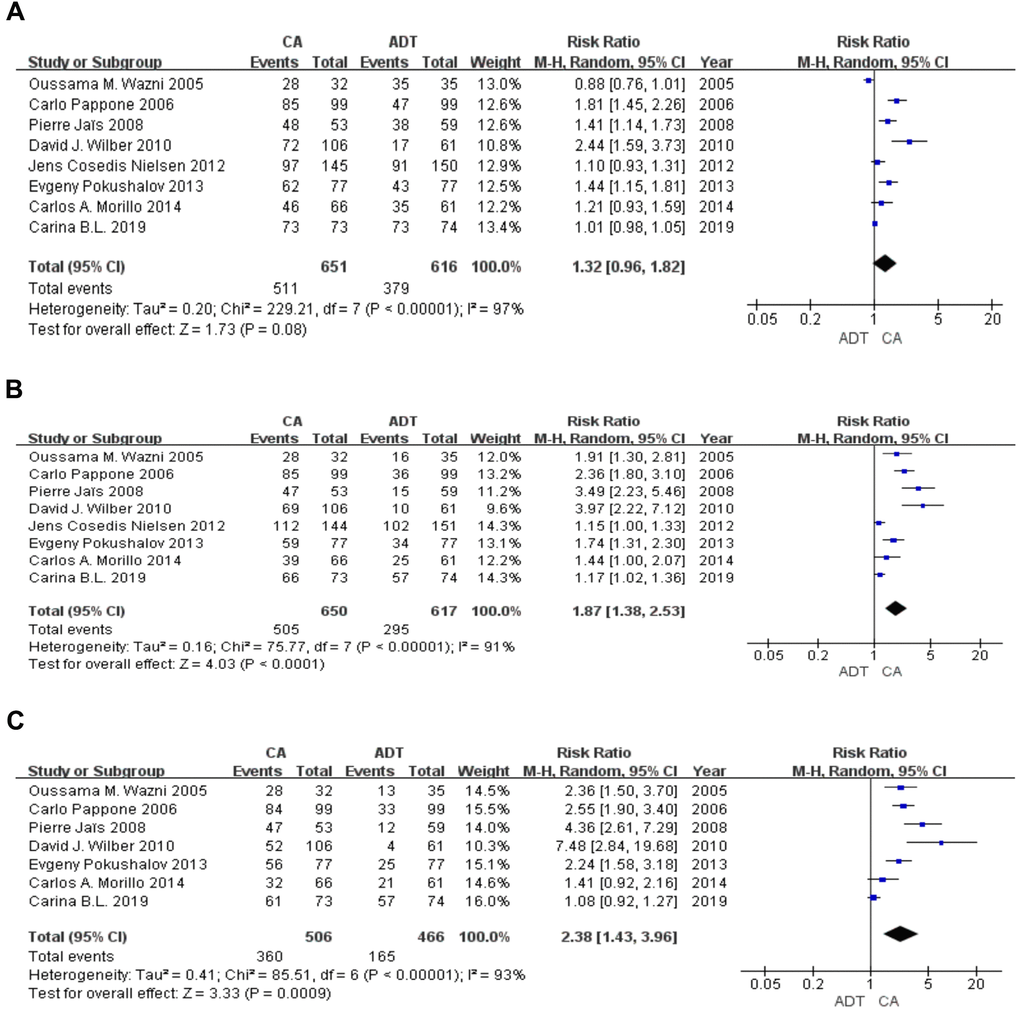
Figure 2.
Forest plot of the AF-free rate in the short term.
The AF-free rate was similar at 3 months (
A
) and significantly higher in the CA group than in the ADT group in 6 (
B
), 9 (
C
) months.