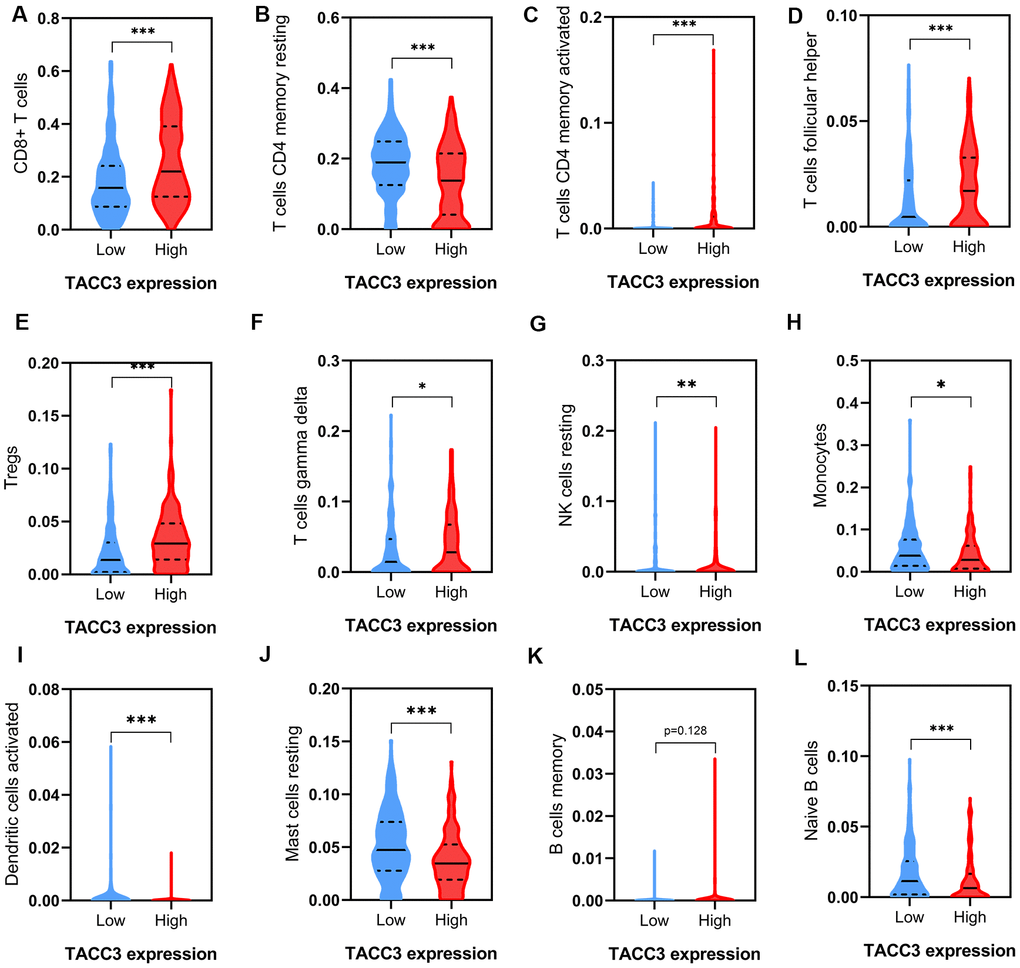
Figure 6.Tumor immune infiltrates in high and low TACC3-expressing KIRC tissues. (A) CD8+ T cells. (B, C) CD 4+ T cells. (D) T follicular helper cells. (E) Tregs. (F) Gamma delta T cells. (G) Resting NK cells. (H) Monocytes. (I) Activated Dendritic cells. (J) Resting Mast cells. (K, L) B cells. The blue and red violins represent immune infiltrated cells in low and high TACC3 expressing groups, respectively. The solid lines represent median expressions of infiltrated cells and the dotted lines represent quartiles. * p<0.05, ** p<0.01, *** p<0.001.